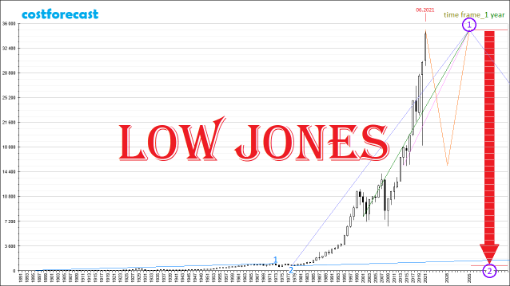
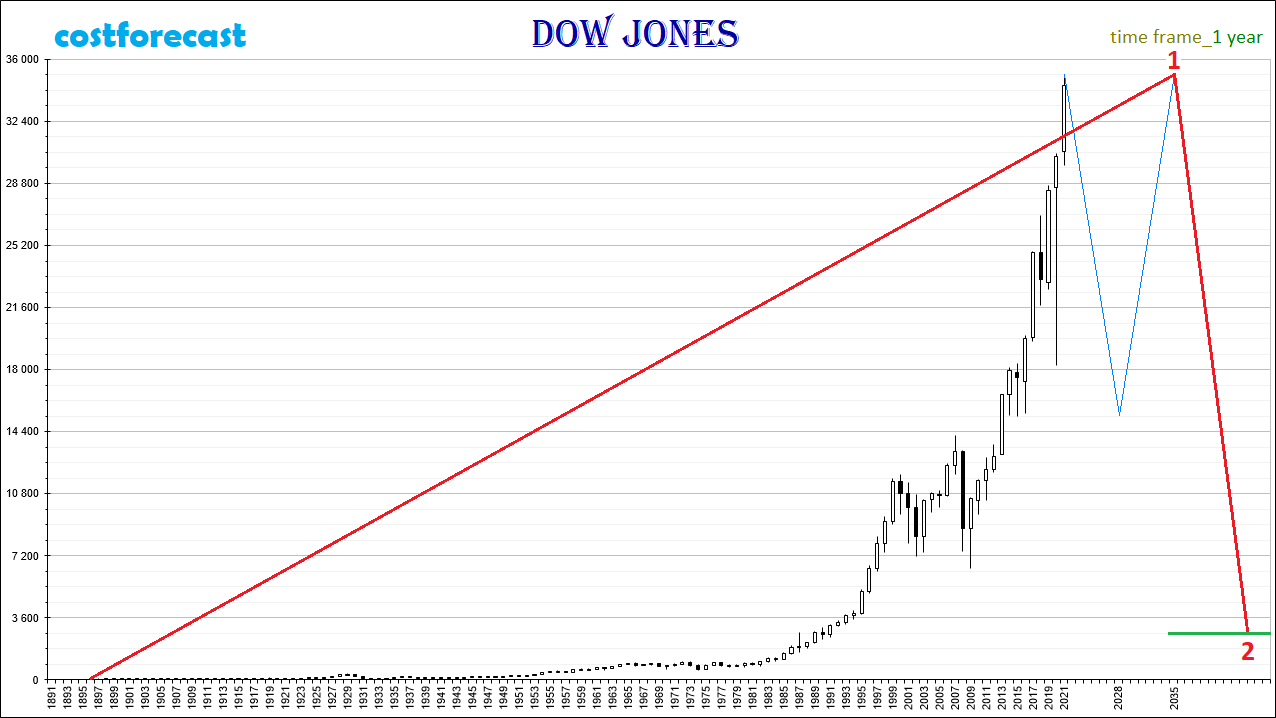
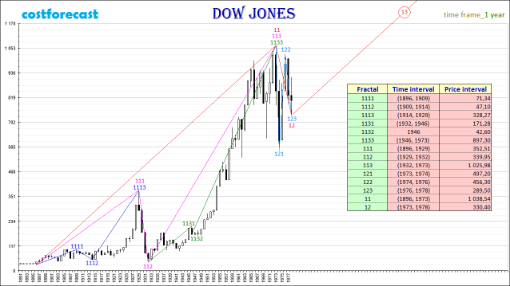
Dow Jones stock index chart, 1896 - 2021. Time frame: 1 year. (02.09.2021)
This video shows the dynamics of the values of the American stock index Dow Jones on a chart with a time frame of 1 year for the time interval from 1896 to June 2021.
Dow Jones stock index chart, 1896 - 2021. Time frame: 1 year. Logarithmic scale. (02.09.2021)
This video shows the dynamics of the values of the American stock index Dow Jones calculated using the natural logarithm on a chart with a time frame of 1 year for the time interval from 1896 to June 2021.
Dow Jones stock index chart, 1896 - 2021. Time frame: 2 years. (02.09.2021)
This video shows the dynamics of the values of the American stock index Dow Jones on a chart with a time frame of 2 years for the time interval from 1896 to June 2021.
Dow Jones stock index chart, 1896 - 2021. Time frame: 2 years. Logarithmic scale. (02.09.2021)
This video shows the dynamics of the values of the American stock index Dow Jones calculated using the natural logarithm on a chart with a time frame of 2 years for the time interval from 1896 to June 2021.
Dow Jones stock index chart, 1896 - 2021. Time frame: 3 years. (02.09.2021)
This video shows the dynamics of the values of the American stock index Dow Jones on a chart with a time frame of 3 years for the time interval from 1896 to June 2021.
Dow Jones stock index chart, 1896 - 2021. Time frame: 3 years. Logarithmic scale. (02.09.2021)
This video shows the dynamics of the values of the American stock index Dow Jones calculated using the natural logarithm on a chart with a time frame of 3 years for the time interval from 1896 to June 2021.
Dow Jones stock index chart, 1896 - 2021. Time frame: 5 years. (02.09.2021)
This video shows the dynamics of the values of the American stock index Dow Jones on a chart with a time frame of 5 years for the time interval from 1896 to June 2021.
Dow Jones stock index chart, 1896 - 2021. Time frame: 5 years. Logarithmic scale. (02.09.2021)
This video shows the dynamics of the values of the American stock index Dow Jones calculated using the natural logarithm on a chart with a time frame of 5 years for the time interval from 1896 to June 2021.
Dow Jones stock index chart, 1896 - 2021. Time frame: 8 years. (02.09.2021)
This video shows the dynamics of the values of the American stock index Dow Jones on a chart with a time frame of 8 years for the time interval from 1896 to June 2021.
Dow Jones stock index chart, 1896 - 2021. Time frame: 8 years. Logarithmic scale. (02.09.2021)
This video shows the dynamics of the values of the American stock index Dow Jones calculated using the natural logarithm on a chart with a time frame of 8 years for the time interval from 1896 to June 2021.
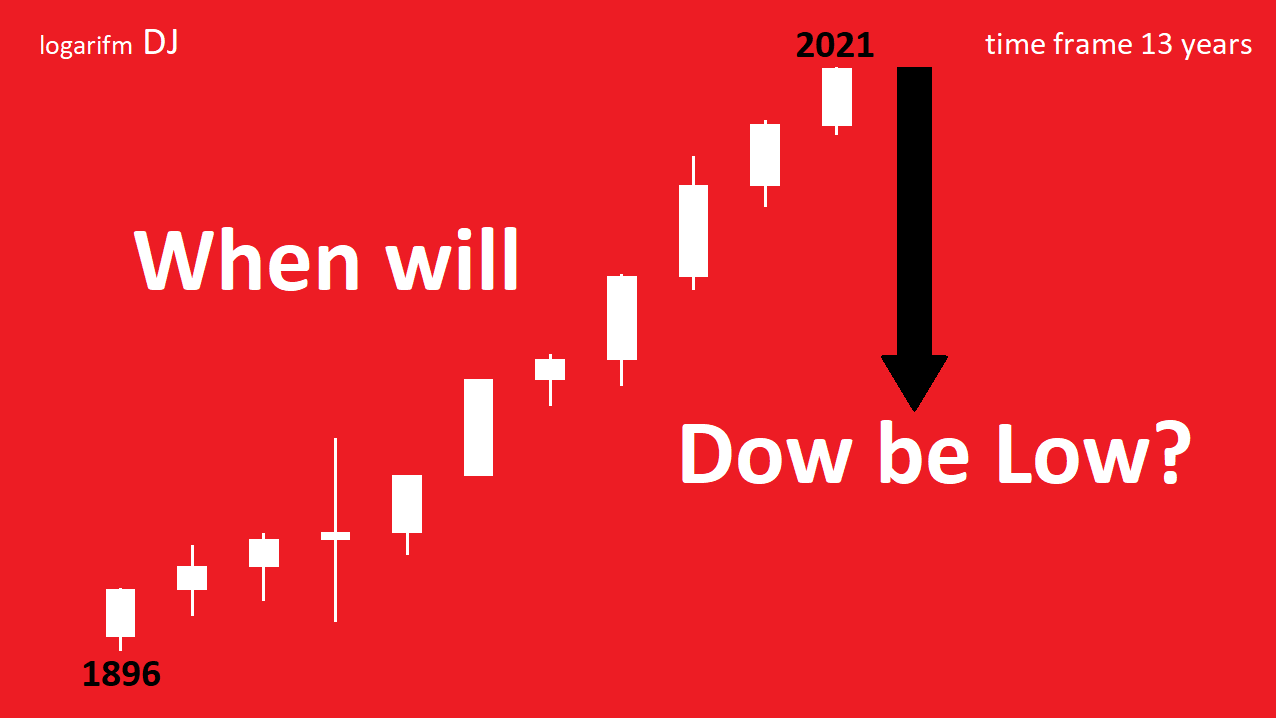
Dow Jones stock index chart, 1896 - 2021. Time frames in years: 10, 13, 21, 34. (02.09.2021)
This video shows the dynamics of the values of the American stock index Dow Jones on a chart with time frames: 10 years, 13 years, 21 years and 34 years for the time interval from 1896 to June 2021.
Dow Jones stock index chart, 1896 - 2021. Time frames in years: 10, 13, 21, 34. Logarithmic scale. (02.09.2021)
This video shows the dynamics of the values of the American stock index Dow Jones calculated using the natural logarithm on a chart with time frames: 10 years, 13 years, 21 years and 34 years for the time interval from 1896 to June 2021.
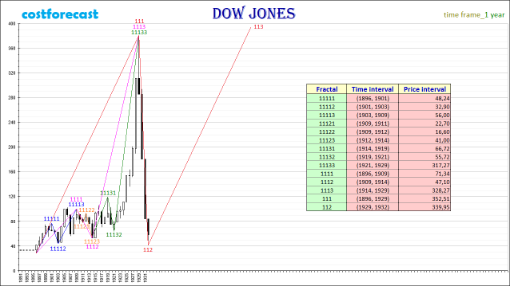
Fractal counting of the Dow Jones stock index chart in the time interval 1896-2021. (02.09.2021)
This video shows the dynamics of the fractal marking of the Dow Jones stock index chart, built with a time frame of 1 year for the period from 1896 to June 2021.
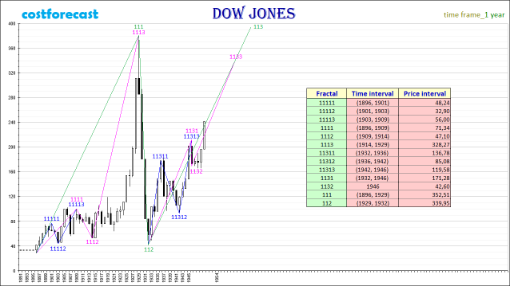
Fractal structure of the Dow Jones stock index chart in the time interval 1896-2021. (02.09.2021)
This video shows the construction of the fractal structure of the Dow Jones stock index chart with a time frame of 1 year for the period from 1896 to June 2021, indicating the orders of the fractals.