When will Dow be Low?
Table of contents.
1. Foreword.
2. The theoretical part.
2.1. Introduction.
2.2. The financial market is the NDASS.
2.3. Cost is a function of time: P = N (T).
2.4. Fractal and fractal structure.
2.5. The order, views and types of fractals.
2.6. Basic fractal.
2.7. General view of the fractal structure.
2.8. Basic fractal dynamics.
2.9. Description of the fractal structure.
2.10. Determination of order and chaos.
2.11. The order of fractals.
2.12. Numbering of fractals.
2.13. Determination of extremum points.
2.14. Views and types of fractals.
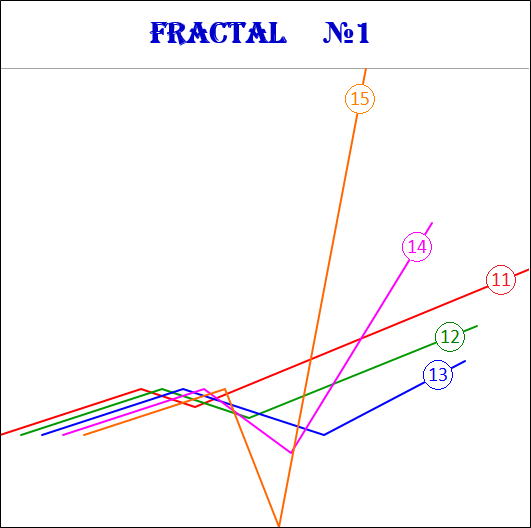
2.15. 15 fractals:
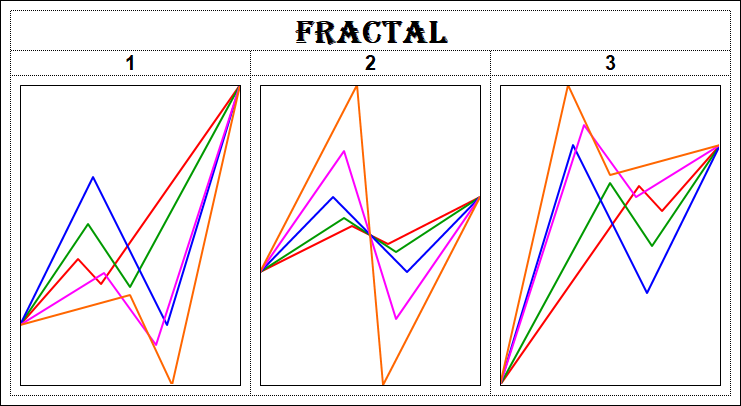
2.15.1. Fractals of the 1st view;
2.15.2. Fractals of the 2nd view;
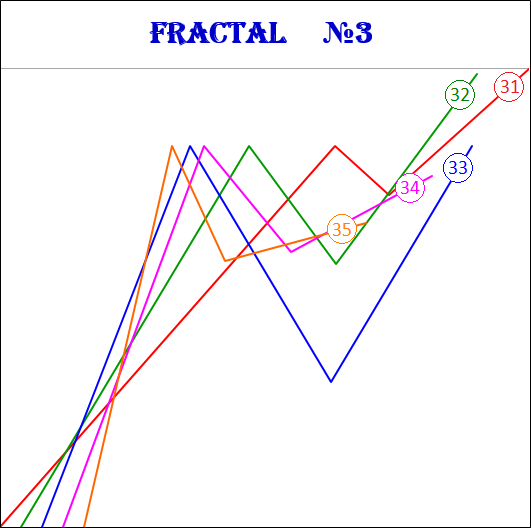
2.15.3. Fractals of the 3rd view.
2.16. Proportions between fractal segments.
2.17. The Alphabet of Niro attractors.
2.18. Bifurcation point and degrees of freedom.
2.19. Cost and time intervals.
2.20. The essence of the modeling method.
3. The practical part.
3.1. Analysis of the fractal structure of the Dow Jones index chart.
3.1.1. Chart with a 1 year time frame.
3.1.2. Chart with a 2 years time frame.
3.1.3. Chart with a time frame of 3 years.
3.1.4. Graph with a 5 years time frame.
3.1.5. Chart with a time frame of 8 years.
3.1.6. Time frame chart of 10 years, 13 years, 21 years and 34 years.
3.1.7. Determining the order of fractals.
3.2. Analysis of US macroeconomic indicators.
3.2.1. Fractal analysis and fundamental analysis as a single analysis.
3.2.1.1. Analysis of the fractal structure of the Dow Jones index chart on the eve of the Great Depression that began in 1929.
3.2.1.2. Analysis of the fractal structure of the Dow Jones index chart on the eve of the Bretton Woods conference in 1944.
3.2.1.3. Analysis of the fractal structure of the Dow Jones index chart on the eve of the Jamaican conference in 1976.
3.2.1.4. Analysis of macroeconomic indicators of the US economy over time (1960, 1970).
3.2.1.5. Analysis of macroeconomic indicators of the US economy over time (1960, 1980).
3.2.1.6. Analysis of macroeconomic indicators of the US economy over time (1960, 1986).
3.2.1.7. Analysis of macroeconomic indicators of the US economy over time (1960, 2020).
3.2.2. Analysis of the fractal structure of the US GDP graphs.
3.2.2.1. In relation to the currencies of other countries.
3.2.2.2. In relation to gold and oil.
3.2.2.3. In relation to world GDP.
3.2.2.3.1. Geopolitics as the basis of the economy.
3.2.2.3.2. USA against the World in the fight for Rimland.
3.2.2.3.3. Orthodoxy and the Russian Spirit.
3.2.2.4. In relation to the GDP of other countries.
3.3. Analysis of the fractal structure of the charts of the cross-rates of the Dow Jones index.
3.3.1. About cross-rates.
3.3.2. Dow Jones Index Currency Cross Rates.
3.3.3. Dow Jones commodity cross rates.
3.3.4. Dow Jones Index Cross Rates.
3.4. Comprehensive analysis.
4. Conclusion.
1. Foreword.
In this article, models of the possible future dynamics of the American Dow Jones stock index will be presented.
To understand the modeling process, a description of the modeling method will first be given. In this regard, this article is conventionally divided into two parts - theoretical and practical.
In the theoretical part, the main aspects of the modeling method are outlined, and in the practical part, the application of the method is shown using the example of the dynamics of the Dow Jones index values.
2. The theoretical part.
2.1 Introduction.
The future dynamics of value in the financial market can be modeled in relation to any underlying assets and their derivatives - currencies and cryptocurrencies, stocks and bonds, stock and other indices, precious and non-ferrous metals, hydrocarbons, industrial raw materials, consumer goods and agricultural products.
The future value of any financial instrument can be predicted with a high degree of accuracy.
2.2. The financial market is the NDASS.
The financial market is a nonlinear dynamic system. It is the nonlinear paradigm that makes it possible to understand and describe the dynamics of the financial market using the appropriate mathematical tools for nonlinear dynamic additive synergetic systems (NDASS).
The method for modeling the dynamics of quotations of financial instruments is based on:
- chaos theory;
- fractal geometry;
- synergetics.
2.3. Cost is a function of time: P = N (T).
Based on the fact that the financial market is a nonlinear dynamic system, the graph of the change in the value of a financial asset from time to time can be viewed as a graph of the function N, which is an operator that sets the correspondence between the set of P values and the set of T values:
P = N(T)
where
P – price of a financial asset;
T – time.
Taking into account that this is a graph of a nonlinear function describing the dynamics of a nonlinear dynamic system, we can say that this graph is an attractor, the structure of which is formed by dynamic fractals.
2.4. Fractal and fractal structure.
The method of modeling the dynamics of the value of a financial asset is based on the analysis of the attractor of the operator N that forms its fractal structure, which gives an understanding of which fractals have formed, which fractals are formed and, as a result, which fractals will be formed, thereby showing the future directions of the possible dynamics of its value.
Let's introduce the definition of fractal and fractal structure.
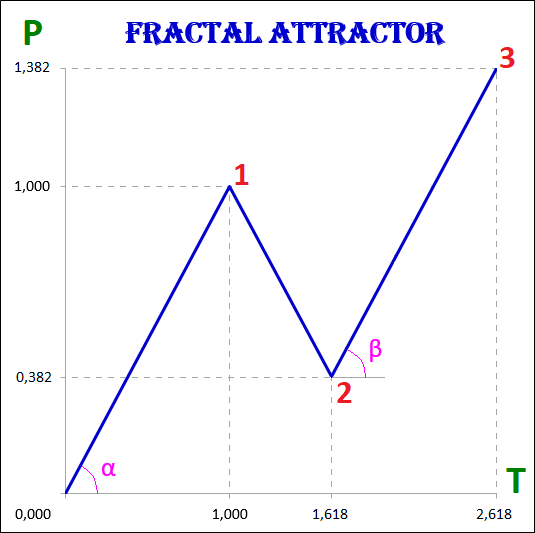
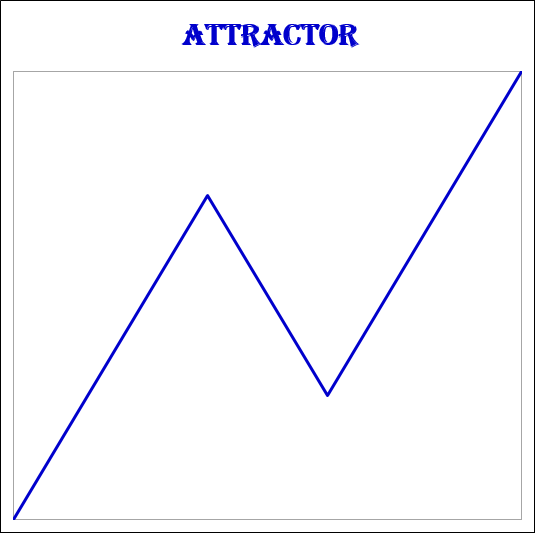
By fractal we mean the simplest attractor of oscillatory motion, consisting of three segments, of which one (2nd segment) is directed in the opposite direction to the other two (1st and 3rd segments).
Fractals are divided into types and types depending on the size of the cost and time intervals of their segments.
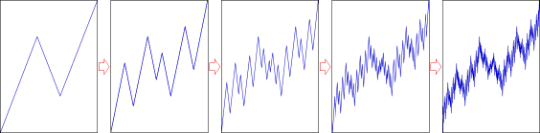
According to the property of self-similarity, fractals of a lower order form fractals of a higher order; accordingly, fractals of a higher order consist of fractals of a lower order.
2.5. The order, views and types of fractals.
Thus, any fractal, in addition to the cost and time values of the intervals, has the following characteristics that describe it:
1. The order of a fractal, indicating which segment it is in relation to fractals of a higher order and which segments of fractals of a lower order it is formed by itself.
2. The type of fractal.
3. View of the fractal.
Fractal structure, in this case, is the interconnection of fractals of different orders, types, types among themselves.
2.8. Basic fractal dynamics.
In this example, all segments of fractals - both the first, and the second, and the third, regardless of their order - the first, second, third, fourth or fifth, have the cost and time intervals of the basic fractal attractor, namely:
1) P1 = P3 and T1 = T3;
2) P2 / P1 = T2 / T1 = 0.618.
2.9. Description of the fractal structure.
The real market dynamics of the value of any financial asset is described by operator N.
A basic fractal is one of the many fractals that form the fractal structure of the graphs of the dynamics of value, which are attractors.
To describe the fractal structure of an attractor means to describe the types and types of fractals of its components, their sequence and location in relation to each other.
The fractal structure of the attractor is both so complex and so simple that it is impossible to say what is more on the chart of quotations of financial assets - chaos or order.
First, we will give a definition of chaos and order in a fractal structure, then we will describe the designation of fractals in a fractal structure, after which we will give their classification by types and types.
2.10. Determination of order and chaos.
Order is a complete fractal.
A fractal is considered completed if all three of its segments are formed - the 1st, 2nd and 3rd. The completion of the 3rd segment indicates the completion of the entire fractal, since this is preceded by the sequential completion of the 1st and 2nd segments.
Chaos in this case is the process of fractal formation.
In other words, order is discrete and chaos is continuous. The end of the 3rd segment of one fractal is replaced by the beginning of the 1st segment of another fractal of the same order or higher.
Taking into account the fact that fractals of a lower order form fractals of a higher order, we can say that chaos and order are inseparable.
Order is present in chaos and chaos is present in order. Chaos and order permeate each other and exist in one another.
The dynamics of value in the financial market can be characterized as both chaotic and orderly. But chaos itself is nothing more than an order of the highest level, because nothing chaotic happens, since the graph of this dynamics is an attractor of a dynamic fractal determined by the operator N.
2.11. The order of fractals.
Each fractal is the first, second, or third segment of another fractal, which has a higher order.
For an accurate description of the location of fractals in a fractal structure, their designation is required, the assignment of certain numbers to the fractals, which makes it possible to unambiguously understand which segments are fractals and what is their order in relation to other fractals.
A fractal whose number consists of one digit is the highest fractal of the 1st order.
A fractal whose number consists of two digits is a fractal of the 2nd order, of three - of the 3rd order, of four - of the 4th, etc.
Fractals of the 4th order make up the fractals of the 3rd order, which in turn make up the fractals of the 2nd order, and those already constitute the fractals of the highest 1st order.
2.12. Numbering of fractals.
The highest 1st order fractal is numbered 1, 2 or 3 according to whether it is the first, second or third segment. A 1st order fractal consists of segments, which are 2nd order fractals.
Fractal number 1 consists of segments numbered 11 (1st segment), 12 (2nd segment) and 13 (3rd segment).
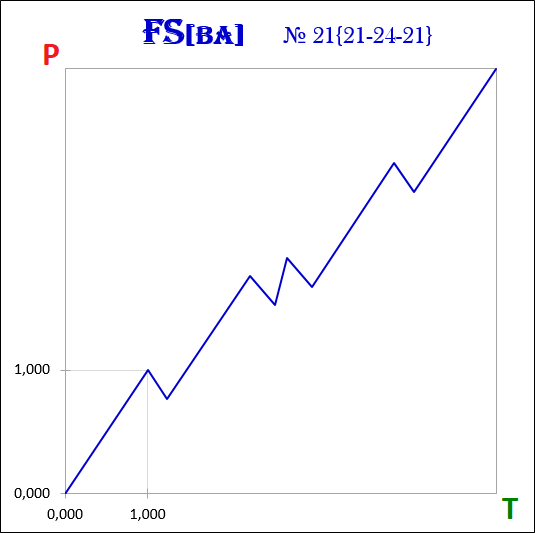
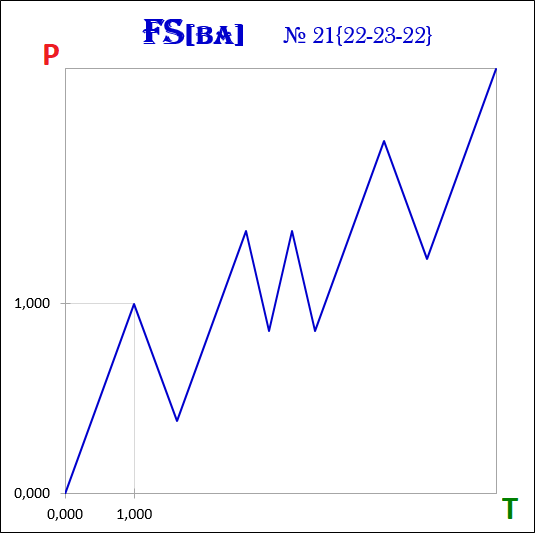
Fractal numbered 2 consists of segments numbered 21 (1st segment), 22 (2nd segment) and 23 (3rd segment).
Fractal number 3 consists of segments numbered 31 (1st segment), 32 (2nd segment) and 33 (3rd segment).
Fractals have the same order if they are either segments of one fractal that composes it, or are segments of other fractals, which in turn are segments of another fractal.
A fractal is one order of magnitude less than another fractal if it is a segment of it.
A fractal is one order of magnitude more than another fractal if that other fractal is a segment of it.
A fractal indicated by a number is similar to a point indicated by coordinates, which is easy to find in the corresponding coordinate system. In our case, the coordinate system is a fractal structure.
So, for example, if the coordinates of the fractal are number 132, then this means that this fractal is the 2nd segment of the 2nd order fractal with the number 13, which in turn is the 3rd segment of the 1st order fractal with the number 1.
2.13. Determination of extremum points.
The dynamics of value in the financial market is an alternation of uptrends and downward trends with the formation of local and global extremum points on the charts.
From the point of view of the fractal structure of charts, extreme points (points where trends change) are points at which some fractal segments complete their formation and others begin to form.
2.14. Views and types of fractals.
The fractal has three segments - the first, second and third. The second segment of the fractal is always directed in the opposite direction to the first and third segments.
In addition to the order, which also indicates the segment number, each fractal segment has two characteristics (two parameters) - the price P (cost interval) and time T (time interval).
P is a value characteristic that shows the length of the projection of the fractal segment onto the price axis, thereby denoting the price interval in which the segment was formed.
T is a temporal characteristic showing the length of the projection of the fractal segment on the time axis, thereby indicating the time interval that it took to form the segment.
A fractal consisting of three segments has six characteristics - these are P1, P2, P3, T1, T2, T3:
• P1 and T1 - price and time intervals of the 1st segment;
• P2 and T2 - price and time intervals of the 2nd segment;
• P3 and T3 - price and time intervals of the 3rd segment.
The main fractal is the basic fractal, the cost and time parameters of the segments of which are related to each other in the following proportions:
1st proportion:
P1/P3 = T1/T3 = 1;
2nd proportion:
P2/P1 = T2/T1 = 0.618.
By changing the values of the parameters of the basic fractal using the Fibonacci coefficients using the golden section, we get a set of fractals that can be classified by views and types.
Three views of fractals can be distinguished from the ratio of the cost parameters of the 1st and 3rd segments.
View No. 1 - these are fractals in which the price interval of the third segment is greater than the price interval of the first segment:
P1 < P3;
View No. 2 - these are fractals in which the price interval of the third segment is equal to the price interval of the first segment:
P1 = P3;
View No. 3 - these are fractals in which the price range of the third segment is less than the price range of the first segment:
P1 > P3.
Regarding each view of fractals, we can say that the 2nd type of fractals characterizes the normal dynamics, the 1st type of fractals characterizes the dynamics with acceleration, and the 3rd type of fractals characterizes the dynamics with deceleration.
From the ratios of cost and time parameters of the 1st, 2nd and 3rd segments, five types of fractals can be distinguished in each form.
Three views and five types give 15 fractals, including the basic one.
Fractals of the 1st view are designated by the following numbers:
11, 12, 13, 14, 15.
Fractals of the 2nd view are designated by the following numbers:
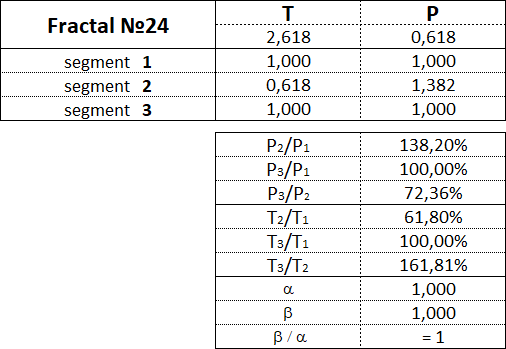
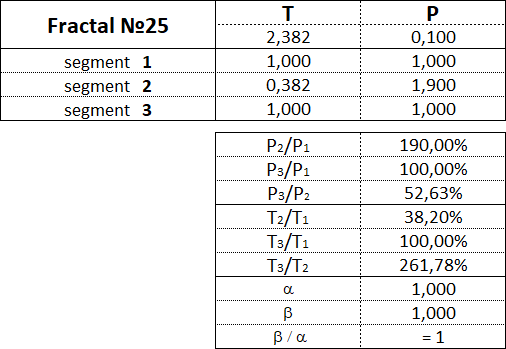
21, 22, 23, 24, 25.
Fractals of the 3rd view are designated by the following numbers:
31, 32, 33, 34, 35.
The first digit in the number indicates the view of fractal - 1st, 2nd or 3rd, and the second digit in the number indicates the type of fractal - 1st, 2nd, 3rd, 4th or 5th.
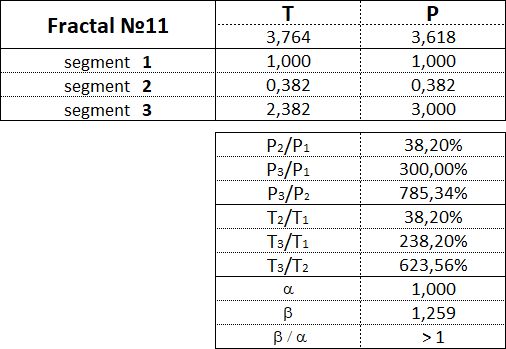
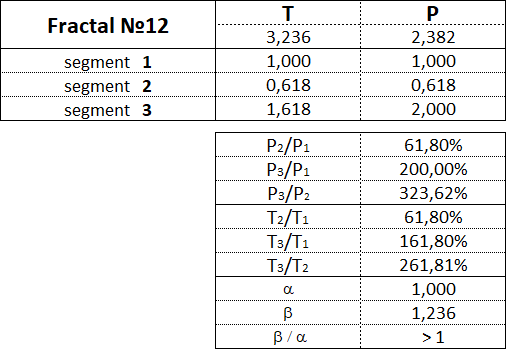
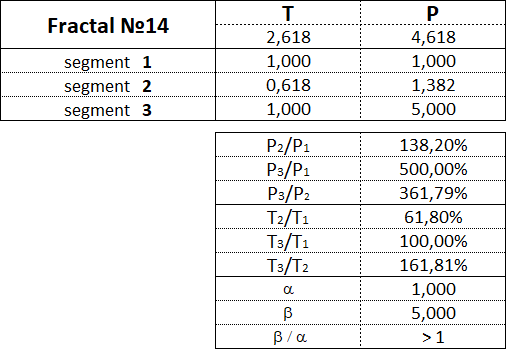
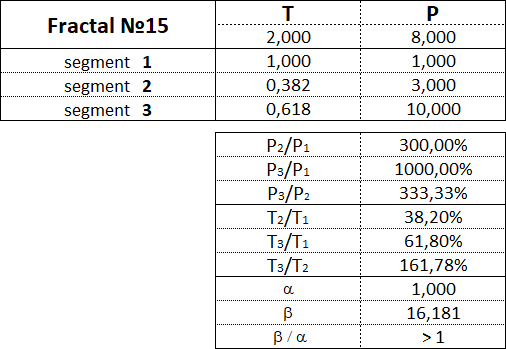
Let's consider each of the 15 fractals separately and denote the proportions between the values of the cost and time intervals of its constituent segments.
Let's start with the fractals of the 1st view, continue with the fractals of the 2nd view and finish with the fractals of the 3rd view.
2.15. 15 fractals:
2.15.1. Fractals of the 1st view.
Fractals of the 1st view have the following numbers: 11, 12, 13, 14, 15.

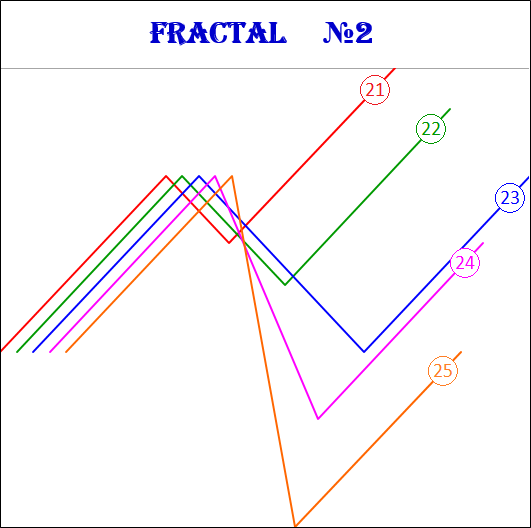
2.15.2. Fractals of the 2nd view.
Fractals of the 2nd type have the following numbers: 21, 22, 23, 24, 25.
2.15.3. Fractals of the 3rd view.
Fractals of the 3rd type have the following numbers: 31, 32, 33, 34, 35.
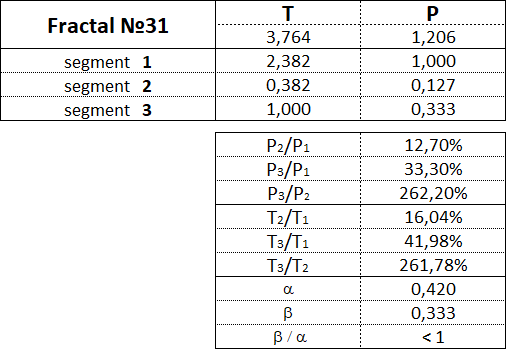
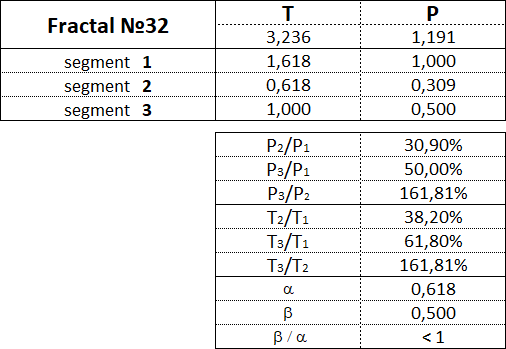
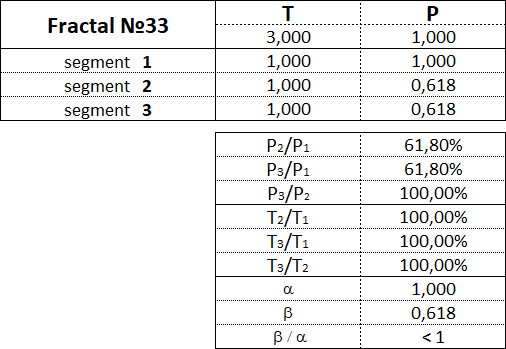
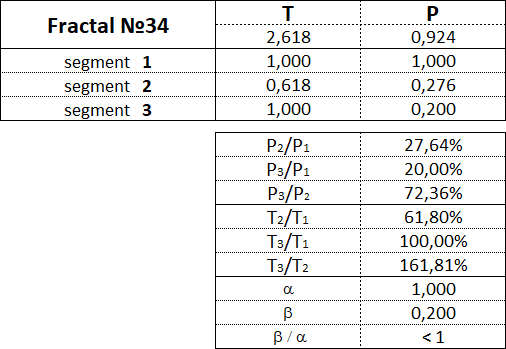
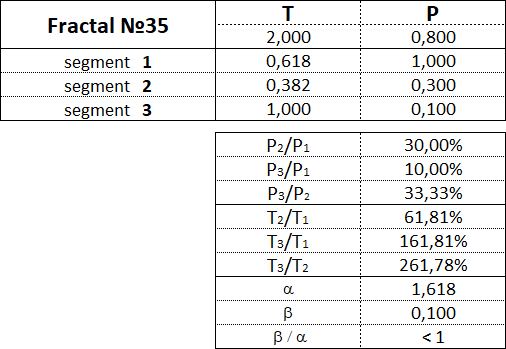
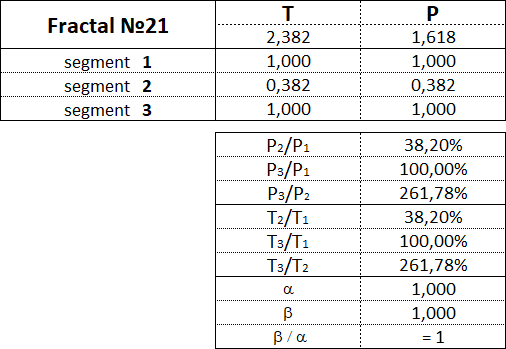
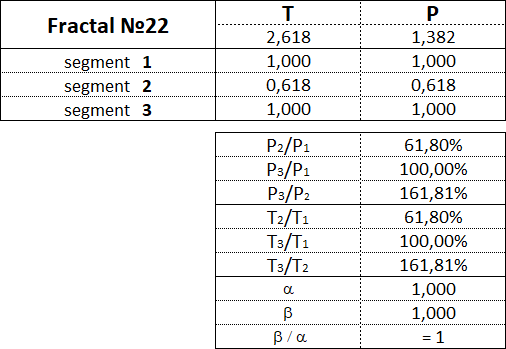
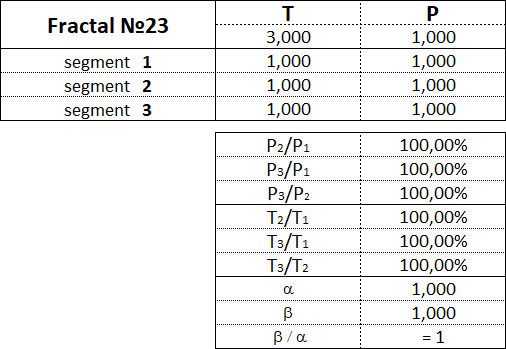
2.16. Proportions between fractal segments.
This table shows the ranges of values as a percentage between the cost and time parameters of the segments for each of the 15 fractals.
2.17. The Alphabet of Niro attractors.
From 15 fractals, you can make up a kind of alphabet of 15 letters.
As in the Morse code, with combinations of two symbols - dots and dashes, you can write any text, and in the alphabet of Niro attractors with combinations of 15 fractals, you can describe any fractal structure FS of any basic asset BA.
2.18. Bifurcation point and degrees of freedom.
A nonlinear dynamic system remains in chaos until a fractal is formed in the fractal structure of the chart. A formed fractal means that the system has passed from a chaotic state to an ordered state. The order that emerged from chaos will be disturbed by the beginning of the formation of a new fractal in the opposite direction to the already formed one, and the system will return to a chaotic state.
At the moment of completion of the fractal, a nonlinear dynamic system is at a bifurcation point, at which the system has several degrees of freedom - several options for the further development of its fractal structure. At the bifurcation point, it is possible to speak unambiguously only about a trend change, that is, a change in the direction of the future fractal to the opposite of the completed fractal, everything else - the cost and time intervals of future fractals, remains unclear, cannot be unambiguously defined.
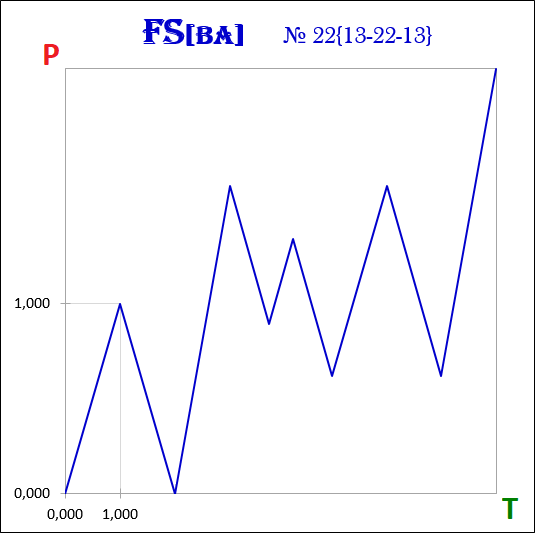
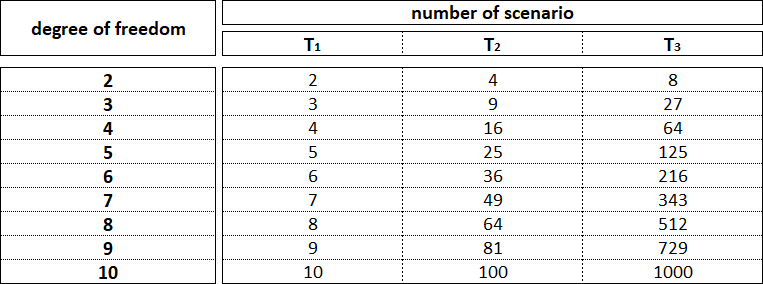
Let us consider an example of the formation of a fractal structure of a nonlinear dynamic system with two degrees of freedom at bifurcation points for three time intervals. A time interval is a period of time that is necessary for the formation of fractals of the same order.
The first development scenario is a scenario in which the cost interval of a new fractal does not exceed the cost interval of the completed fractal.
The second development scenario is a scenario in which the cost interval of the new fractal exceeds the cost interval of the completed fractal.
Let us denote by T0 the time interval for which the initial fractal was formed.
Then, in the T1 interval, two fractals can be formed, in the T2 interval - four fractals, and in the T3 interval - eight fractals.
The number of degrees of freedom at bifurcation points of a nonlinear dynamic system determines the number of possible scenarios for the development of its fractal structure in the current time interval, which with each subsequent time interval will increase exponentially.
The number of degrees of freedom at the bifurcation point of a nonlinear dynamic system is not constant and depends on its location in the fractal structure.
A nonlinear dynamic system has the minimum number of degrees of freedom when the bifurcation point in the fractal structure is at the beginning of the formation of the smallest order fractal, which completes the largest order fractal.
The maximum number of degrees of freedom falls on the bifurcation point that separates the completion of the highest order fractal and the beginning of the lowest order fractal.
Taking this into account, modeling the fractal structure of a nonlinear dynamic system beyond the second time interval has no practical meaning due to the presence of a large number of possible scenarios for the development of a fractal structure.
2.19. Cost and time intervals.
The fractal structure of the attractor is formed by dynamic fractals of various orders. At any moment in time, all fractals that form a fractal structure are at different stages of their completion - fractals of some orders can be fully completed, other orders - be in the initial stage of their formation, third orders - in the final, and the fourth - in an intermediate one.
Completed, i.e. formed, a fractal is a fractal in which all three of its segments are sequentially completed. Completion of the 3rd fractal segment is the completion of the entire fractal.
Completion of a fractal means the completion of the cost and time intervals of its segments.
The cost interval of a fractal is the interval between the beginning of the projection onto the price axis of the 1st fractal segment and the end of the projection of its 3rd segment.
The time interval of a fractal is the interval between the beginning of the projection on the time axis of the 1st fractal segment and the end of the projection of its 3rd segment. The time interval of a fractal is the sum of the time intervals of all three of its segments.
The strings of the fractal structure of the attractor are horizontal levels drawn through the extremum points formed in each month. The number of strings in a fractal structure is equal to twice the number of months it took to form it.
In the overwhelming majority of cases, the beginning and end of the cost intervals will be in the vicinity of the points lying on the strings.
The length of the cost interval is an absolute value, and the length of the time interval is a relative value.
Time is a form of the process of formation of a fractal structure and a condition for the possibility of its change.
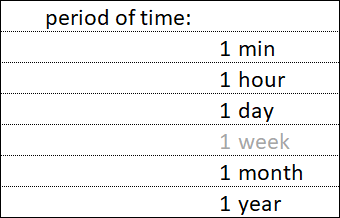
All these simple periods, except for the week, are multiples of each other. Thus, an annual period contains an integer number of monthly periods, a monthly period contains an integer number of day periods, a day period contains an integer number of hourly periods, and an hour period contains an integer number of minute periods.
The time intervals of the formed fractals are located unevenly relative to simple time periods, but with a certain pattern.
The beginning and end of a time interval can coincide with the beginning and end of a simple time period, but in the vast majority of cases, the beginning and end of time intervals fall in the vicinity of points that divide simple time periods along the golden ratio with Fibonacci coefficients of 0.382 and 0.618.
In order to decompose the fractal structure of a chart into separate fractals with three segments, it is not enough to analyze charts that are built according to simple time periods - 1 minute, 1 hour, 1 day, 1 month, 1 year. To find the fractal structure, you need to analyze the charts that are built on all possible time frames.
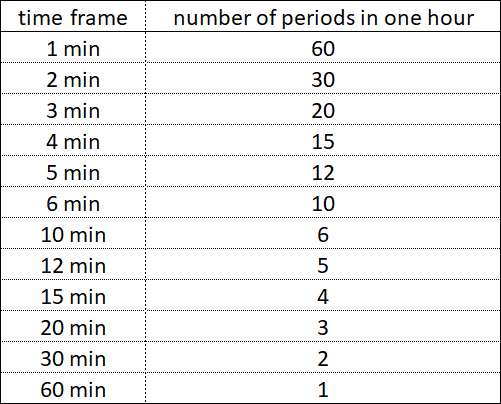
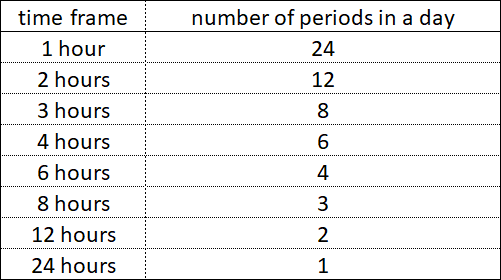
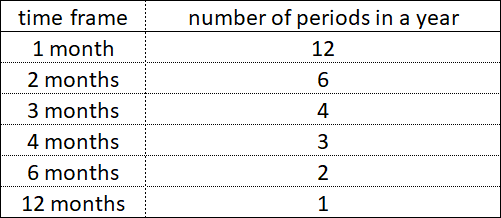
Within each simple period of time - whether it be 1 hour, 1 day or 1 year, there are smaller time periods, their components, which end simultaneously with each other at certain time intervals.
Within 1 hour, periods with time frames of 30 minutes, 20 minutes, 12 minutes do not end at the same time, but periods with time frames of 30 minutes, 15 minutes, 5 minutes in some time intervals end simultaneously.
Within 1 day, periods with time frames of 8 hours and 6 hours do not end at the same time, but periods with time frames of 8 hours, 4 hours, 2 hours or 12 hours, 6 hours and 3 hours in some time intervals end simultaneously.
Within 1 year, periods with time frames of 4 months and 3 months do not end at the same time, but periods with time frames of 6 months and 2 months on some time intervals end simultaneously.
The periods of all time frames, starting at the same time, also end simultaneously at the end of the simple time period.
Low-order fractals form fractal structures on time intervals with daily time-frames, and fractal structures with fractals of even lower orders are formed on time intervals with hourly time-frames.
Higher order fractals form fractal structures on time intervals with monthly time frames, and higher order fractals form fractal structures on time intervals with annual time frames.
Completions of cost and time intervals occur at bifurcation points, which are in the overwhelming majority of cases on the strings of fractal structures. Taking into account the presence of a large number of degrees of freedom at bifurcation points in a nonlinear dynamic system, modeling the future fractal structure further than the second cost and time intervals leads to a huge number of models, often having the same probability of implementation, which does not allow choosing one single model as the most probable for implementation.
A more accurate prediction of the future dynamics of the value of financial instruments is achieved by analyzing and modeling the fractal structure of their charts between two bifurcation points closest to each other, i.e. only in the current cost and time intervals - in the direction of the formation of either the 1st segment, or the 2nd segment, or the 3rd segment of the fractal.
For short-term forecasting of the dynamics of the value of financial instruments, it is necessary to simulate the fractal structure of charts, which are built on the minute and hour time frames.
For medium-term forecasting of the dynamics of the value of financial instruments, it is necessary to simulate the fractal structure of charts, which are built on daily and weekly time frames.
For long-term forecasting of the dynamics of the value of financial instruments, it is necessary to simulate the fractal structure of charts, which are built on monthly and annual time frames.
The forecasting horizon in all three variants will be the same - the current cost and current time intervals of the emerging fractal, i.e. forming its first, second or third segments.
But on charts with hourly time frames, the forecast horizon will be a period of several days or weeks, on charts with daily and weekly time frames, the forecast horizon will be a period of several months, but on charts with monthly and annual time frames, the forecast horizon will be there will be a period of several years and even decades.
The cost intervals of fractals, regardless of their order, tend to end at points that are either at points lying on the strings of the fractal structure, or at points located at a distance from the strings in accordance with the Fibonacci coefficients.
Time intervals of fractals, the order of which is lower than the highest, tend to completion in the vicinity of the end points of time intervals, which are located within simple time periods in accordance with the Fibonacci ratios.
The overlapping of the end points of the cost and time intervals of fractals form bifurcation points that predetermine the values of the future cost and time intervals of new fractals.
Forecasting the dynamics of value for a long-term period requires an analysis of fractal structures formed by fractals of the highest and highest orders, the formation of bifurcation points in which is different from the fractal structures formed by fractals of the order below the highest.
The completion of the time intervals of fractals of the highest and highest orders occurs in the vicinity of the points at which the maximum number of annual time frames ends simultaneously:
1, 2, 3, 4, 5, 6, 7, 8, 9, 10, 11, 12, 13, 14, 15, 16, 17, 18, 19, 20, 21, 22, 23, 24, 25, 26, 27, 28, 29, 30, 31, 32, 33 and 34.
Special attention should be paid to the simultaneous termination of annual time frames, among which there are Fibonacci time frames: 1, 2, 3, 5, 8, 13, 21, 34.
On a time interval from 1 year to 40 years, the maximum number of simultaneous endings of time frames is 8.
There are 8 simultaneous endings in the 24th, 30th and 36th years.
In 24 year the following annual time frames end at the same time:
1, 2, 3, 4, 6, 8, 12, 24.
In 30 year the following annual time frames end at the same time:
1, 2, 3, 5, 6, 10, 15, 30.
In 36 year the following annual time frames end at the same time:
1, 2, 3, 4, 6, 9, 12, 18.
Over the time period 1 to 2200, the number of simultaneous time frame completions in years 1 to 34 ranges from 1 to 18.
18 is the maximum number of concurrent completions in this time frame, which occurs in 1680. This year, the following time frames are completed simultaneously: 1, 2, 3, 4, 5, 6, 7, 8, 10, 12, 14, 15, 16, 20, 21, 24, 28, 30.
The number of simultaneous completions of time frames in the interval (1; 2200) from 1 to 9 is 93.09%, the remaining 6.91% is accounted for by the number of simultaneous completions from 10 to 18.
The end of the time intervals of the highest order fractals occurs at the time intervals where the number of simultaneous time frame completions ranges from 10 to 18.
A summary of the simultaneous completion of time frames in years 1 through 34 for the period 1 through 2200 is shown in the graph and table below.
When analyzing the time intervals of fractals of the highest orders, the unfinished year is rounded up to the completed one, which does not allow making the analysis more accurate.
To analyze time intervals with an accuracy of a month, it is necessary to construct, by analogy with the annual time frames, monthly time frames from 1 to 34 for the period from 1 year to 2100 and find the time intervals in which the maximum number of periods with different monthly ends at the same time frames.
In this case, December 2000 would be a 24000 month, December 2100 would be a 25200 month, and July 2021 would be a 24247 month.
The time interval 1-2100 contains 25'200 months. On this time interval, the number of simultaneous time frame completions in months 1 to 34 varies from 1 to 21 (21/34 = 0.618 - the “golden ratio”).
21 is the maximum number of concurrent completions in this time interval, which occurs in the following years: 840, 1260, 1540, 1680, and 2100.
The number of simultaneous completions of time frames in the interval (1; 25200) from 1 to 9 is 92.96%, the remaining 7.04% is accounted for by the number of simultaneous completions from 10 to 21.
The end of the time intervals of the highest order fractals occurs at the time intervals where the number of simultaneous time frame completions ranges from 10 to 21.
A summary of the simultaneous completion of time frames in months 1 through 34 for the period 1 through 2100 is shown in the graph and table below.
Let's designate the time interval as (1; L). where L ∈ N.
ТF - time frame, time period repeating more than 1 time in the interval (1; L). TF ∈ N.
m - simultaneous end of different time frames in the interval (1; L). m ∈ N.
nm - the number of simultaneous endings of different time frames in the interval (1; L). n ∈ N.
Earlier, the distribution of nm for TF = 34 was shown on two intervals for L1 = 2’200 and L2 = 25’200.
The rise and fall of business activity shape the ups and downs in the economy, denoting economic cycles consisting of repeated recessions, depressions and revivals in the economy.
The dynamics of the financial market takes place in correlation with economic cycles. Changes in the direction of dynamics of the values of stock indices, currency quotes, the cost of raw materials show the end of some economic cycles and the beginning of others.
At the points at which time frames in years 1 to 34 end at the same time in the amount of more than 10 completions, there are changes in economic cycles. In the vicinity of these points, bifurcation points are formed in the fractal structure of the graphs of the dynamics of the value of financial assets in which some fractals end and others begin.
To simulate the dynamics of economic processes, it is required to analyze the fractal structures of the charts, which are built according to the following annual Fibonacci time frames:
1, 2, 3, 5, 8, 13, 21, 34, 55 and 10 years old.
The overlay of time intervals with the simultaneous completion of a large number of time frames from 1 year to 34th on time intervals with the simultaneous completion of a large number of timeframes from 1 month to 34th gives a clear understanding of where the time intervals of fractals will end of the highest order.
Simultaneous endings of time frames within a time interval occur on specific dates, which are counted from the beginning of the interval.
The modern chronology originates from the year in which he was born on Earth in a human body in one of his three hypostases - the Son of God, our God Jesus Christ.
There are no clear and unequivocal facts confirming the birth of our God Jesus Christ in the very year from which the modern chronology is based. However, for Faith and for the salvation of the human soul, it is not the year of Birth that is important, but the Immaculate Conception and Birth of Jesus Christ, His Life and His Teachings, His Crucifixion and His Suffering, His Resurrection from the dead and His Ascension.
There are many arguments pointing to the birth of the Son of God Jesus Christ 5 years earlier than it is commonly believed.
Taking into account the uncertainty regarding the beginning of the modern chronology, for the analysis of the simultaneous completion of the annual intervals in order to identify the time intervals on which the global bifurcation points are formed, this fact must be taken into account.
Given this fact, the current year 2021 could be the year 2026.
Let's build the annual time frames from 1 to 144 (12²) and find the time intervals on which there is the maximum number of their simultaneous completions, paying special attention to those time intervals where the Fibonacci time frames end and paying attention to the difference between the time intervals equal to 5 years.
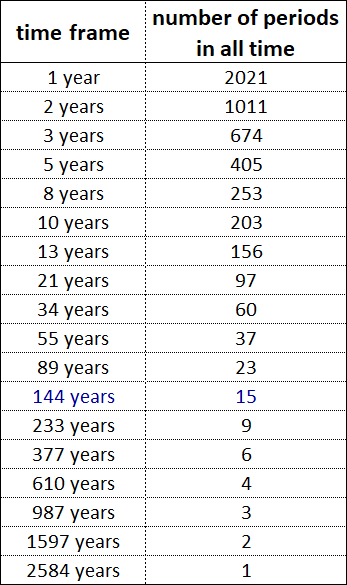
The vertices of the indicated parabolas are located in the vicinity of the time interval from 2021 to 2026. Taking into account the generally accepted time calculation, the upper limit of the range corresponds to the current year 2021. If the time is from 5 BC, then the current year is 2026, which corresponds to the lower end of the range.
Given the lack of complete clarity about the beginning of the modern chronology, a situation is obtained in which the current time is either at the beginning of the 2021-2026 range, or at its end.
The time interval 2021-2026, in which the vertices of the indicated parabolas fall, is an interval in the vicinity of which the maximum possible number of time frames ends in years from the 1st to the 144th, which indicates the completion of higher-order fractals in this time interval.
The time range 2021-2026, in the vicinity of which + - 2 years, ends 56 time-frames, is followed by the year 2040, in which 23 time-frames end at the same time, which indicates the end of the time intervals of fractals of the highest orders.
2021-2026 is the time of the beginning of the end. Higher-order fractals that began in this period will complete the highest-order fractals by 2040.
2040 is a milestone year, after which new fractals of higher and higher orders will begin to form in fractal structures.
2.20. The essence of the modeling method.
At this, with time intervals, you can finish and complete the theoretical part by designating the essence of the method for modeling the dynamics of the value of financial assets, which consists in identifying the fractal structure of the financial asset graph and describing it using attractors from the Niro alphabet.
The process of formation of the fractal structure of the attractor by dynamic fractals is cyclical, which means it is predictable, i.e. it is possible to simulate the future dynamics of quotations of any financial instruments.
In the graphs of the dynamics of value in the financial market, there is a cycle, which consists in the formation of a fractal and is expressed in:
1. Formation of the 1st segment of the fractal.
2. Formation of the 2nd fractal segment directed in the opposite direction to the 1st.
3. Formation of the 3rd segment of the fractal, which has the same direction as the 1st.
After completing this cycle, the exact same cycle begins, but in the opposite direction. All these actions continue indefinitely - the first segment is always replaced by the second segment, the second segment is always replaced by the third segment, and the third segment is always replaced by the first segment.
The cyclical nature of the process of formation of fractals and fractal structure in accordance with a certain order gives an understanding of which segment of the fractal and in which direction will be formed after the formation of the current segment is completed.
At any moment in time, the dynamics of the value of any financial asset is in the formation of one of the three fractal segments - the first, second or third. After the first segment of the fractal, the second segment of the same fractal is always formed, after which the third segment of the same fractal is always formed and then the first segment begins to form again, but already of another fractal, which has either the same order or a larger one, and which is necessarily directed in the opposite direction the previous fractal.
The extreme points on the chart are the points at which either the first segments end and the second begin, or the second segments end and the third begin, or the third segments end and the first begin. The extremum points define the boundaries of the cost and time intervals of fractals in the fractal structures of attractors.
The proportions between the values of the cost and time intervals of the segments allow you to determine:
- what segments are they - the first, the second or the third,
- what kinds and types of fractals these segments form, and
- what is the order of the formed fractals in the fractal structure in relation to each other.
The method of modeling the dynamics of quotations of financial instruments is based on determining what the current fractal segment is - the first, second or third, in order to determine which segment of the fractal will be the next after the current one.
The alphabet of Niro attractors consists of 15 fractals:
11, 12, 13, 14, 15; 21, 22, 23, 24, 25; 31, 32, 33, 34, 35;
which are divided into three types, each of which has five types.
Each of the 15 fractals is an attractor to which the graph of any nonlinear dynamical system will strive.
Modeling the future dynamics of value begins with the analysis of the main fractal structure, consisting of fractals of the highest order, that is, with the analysis of charts built on annual time frames. As part of the analysis of the main fractal structure, it is determined to which of the 15 types of attractors the graph of the dynamics of the value of a financial asset belongs.
Having identified the attractor of the main fractal structure, it is possible to make not only long-term forecasts of the value dynamics, but also medium-term and short-term forecasts, because the formation of fractal structures consisting of fractals with an order below the highest will occur in strict accordance and subordination to the main fractal structure.
Thus, in order to clearly see the future dynamics of the financial market, it is necessary to know the alphabet of Niro attractors and be able to use it to read and describe fractal structures of charts of financial instruments traded in the currency, stock and commodity markets.
The Niro alphabet excludes apophenia from the dynamics of the financial market and makes the pattern in the dynamics of the value of financial assets clear and obvious. In this case, everyone can become a clairvoyant.
At this point, consideration of the main aspects of the method for modeling the dynamics of value in the financial market can be completed, from the theoretical part to move on to the practical and consider the application of the method of modeling future dynamics on a specific example.
3. The practical part.
3.1. Analysis of the fractal structure of the Dow Jones index chart.
3.1.1. Chart with a 1 year time frame.
Let us consider a method for modeling the dynamics of the financial market using the example of modeling the dynamics of the values of the American stock index Dow Jones.
Modeling the future dynamics of the index is associated with finding an attractor to which the global fractal structure of the chart seeks.
Finding the fractal structure of a chart is finding the fractals that make up it. Finding a fractal means determining its cost and time intervals, indicating its order and designating its three segments.
Finding the global fractal structure begins with the analysis of charts that are built on annual time frames.
The analysis of the graphs is carried out in chronological order with the sequential identification of emerging fractals (their segments), their combination and designation of the fractal structure.
The fractal structure of the chart, formed by fractals of the highest order, predetermines the future dynamics of the Dow Jones index values in the long, medium and short term.
The Dow Jones index has been calculated since 1896 and its first value was 40.94 points.
The Dow Jones stock index is plotted sequentially year after year from 1896 to June 2021.
As of the end of June 2021, combining completed fractals of various orders with each other, we can talk about the following local fractal structures formed by them on the following time intervals:
1) Time interval (1896; 1929): FS (DJ) → 14 ≡ {22, 13, 14};
2) Time interval (1932; 1973): FS (DJ) → 11 ≡ {22, MS, 11};
3) Time interval (1896; 1973): FS (DJ) → 13 ≡ {14, MS, 11}.
Taking into account the formed three local fractal structures, we can talk about the possible formation of the following fourth local fractal structure:
FS (DJ) → 11 ≡ {11, MS, 11},
which has a time interval from 1978 to 2035.
As part of the formation of this local fractal structure, the following fractals of different orders will be formed at the following time intervals:
1) Fractal No. 23 - time interval (2014; 2035);
2) Fractal No. 11 - time interval (2001; 2035);
3) Fractal No. 11 - time interval (1978; 2035).
The future dynamics of the Dow Jones stock index values is determined by the attractor from the Niro alphabet, towards which the global fractal structure will strive.
Determining the attractor of the global fractal chart structure is impossible without determining the order of each of its constituent fractals and describing its location in the fractal structure.
Determining the order of fractals in a fractal structure begins with finding the highest order fractal.
The highest order fractal is the mono segment (MS) on the chart, which is plotted with the highest annual Fibonacci time frame value: 1, 2, 3, 5, 8, 13, 21, 34, 55, etc.
Let's plot the Dow Jones index using annual Fibonacci time frames and assign the highest order to the fractal in the fractal structure, which is a mono-segment. This mono-segment will be the fractal of the highest order, from which the subsequent numbering of the orders of fractals in the fractal structure will follow.
The fractal structure of the chart, which is built with a time frame of 1 year, is the most difficult to segment in relation to fractal structures of charts with time frames of more than 1 year.
Increasing the time-frame value leads to a simplification of the fractal structure of the chart.
Consider the following chart with a 2 years time frame.
3.1.2. Chart with a 2 years time frame.
The dynamics of the Dow Jones index values from 1896 to June 2021 on a chart with a time frame of 2 years.
With a time frame of 2 years, you can build two charts that are alternative to each other.
For chart # 1, the start period will be the time interval [1, 2], then - [3, 4], [5, 6], [7, 8], etc.
For chart # 2, the start period will be the time interval [2, 3], then - [4, 5], [6, 7], [8, 9], etc.
Graph # 1 shows the dynamics, which corresponds to the generally accepted time calculation.
If we start calculating time from 5 BC, then the dynamics will look as shown in the graph №2.
The fractal structure of chart # 1 and chart # 2 is the same. Construction of two graphs and analysis of the fractal structure on each of them makes it easy to determine the cost and time intervals of fractals.
The fractal structure of the chart, which is built with a 2 years time frame, is segmented.
Consider the following chart with a 3 years time frame.
3.1.3. Chart with a time frame of 3 years.
The dynamics of the Dow Jones index values from 1896 to June 2021 on a chart with a time frame of 3 years.
With a 3 years time frame, three alternative charts can be plotted.
For chart # 1, the start period will be the time interval [1, 3], then - [4, 6], [7, 9], [10, 12], etc.
For chart # 2, the start period will be the time interval [2, 4], then - [5, 7], [8, 10], [11, 13], etc.
For chart # 3, the start period will be the time interval [3, 5], then - [6, 8], [9, 11], [12, 14], etc.
Graph # 1 shows the dynamics, which corresponds to the generally accepted time calculation.
If we start calculating time from 5 BC, then the dynamics will look as shown in the graph №2.
The fractal structure of chart # 1, chart # 2 and chart # 3 is the same. Building three graphs and analyzing the fractal structure on each of them makes it easy to determine the cost and time intervals of fractals.
The fractal structure of the chart, which is built with a 3 years time frame, is segmented.
Consider the following chart with a 5 years time frame.
3.1.4. Graph with a 5 years time frame.
The dynamics of the Dow Jones index values from 1896 to June 2021 on a chart with a time frame of 5 years.
With a 5 years time frame, five alternative charts can be plotted.
For chart # 1, the starting period will be the time interval [1, 5], then - [6, 10], [11, 15], [16, 20], etc.
For chart # 2, the start period will be the time interval [2, 6], then - [7, 11], [12, 16], [17, 21], etc.
For chart # 3, the starting period will be the time interval [3, 7], then - [8, 12], [13, 17], [18, 22], etc.
For chart # 4, the start period will be the time interval [4, 8], then - [9, 13], [14, 18], [19, 23], etc.
For chart # 5, the start period will be the time interval [5, 9], then - [10, 14], [15, 19], [20, 24], etc.
Graph # 1 shows the dynamics, which corresponds to the generally accepted time calculation. If the time is started from 5 BC, then the dynamics will look the same.
The fractal structure of chart # 1, chart # 2, chart # 3, chart # 4 and chart # 5 is the same. Building five graphs and analyzing the fractal structure on each of them makes it easy to determine the cost and time intervals of fractals.
The fractal structure of the chart, which is plotted with a 5 years time frame, is segmented.
Consider the following chart with a time frame of 8 years.
3.1.5. Chart with a time frame of 8 years.
The dynamics of the Dow Jones index values from 1896 to June 2021 on a chart with a time frame of 8 years.
With a time frame of 8 years, eight alternative charts can be plotted.
For chart # 1, the start period will be the time interval [1, 8], then - [9, 16], [17, 24], [25, 32], etc.
For chart # 2, the start period will be the time interval [2, 9], then - [10, 17], [18, 25], [26, 33], etc.
For chart # 3, the start period will be the time interval [3, 10], then - [11, 18], [19, 26], [27, 34], etc.
For chart # 4, the start period will be the time interval [4, 11], then - [12, 19], [20, 27], [28, 25], etc.
For chart # 5, the start period will be the time interval [5, 12], then - [13, 20], [21, 28], [29, 36], etc.
For chart # 6, the start period will be the time interval [6, 13], then - [14, 21], [22, 29], [30, 37], etc.
For chart # 7, the starting period will be the time interval [7, 14], then - [15, 22], [23, 30], [31, 38], etc.
For chart # 8, the start period will be the time interval [8, 15], then - [16, 23], [24, 31], [32, 39], etc.
Graph # 1 shows the dynamics, which corresponds to the generally accepted time calculation.
If we start calculating time from 5 BC, then the dynamics will look as shown in the graph №4.
The fractal structure of chart no. 1, chart no. 2, chart no. 3, chart no. 4, chart no. 5, chart no. 6, chart no. 7 and chart no. 8 are the same. Building eight graphs and analyzing the fractal structure on each of them makes it easy to determine the cost and time intervals of fractals.
The fractal structure of the chart, which is built with a time frame of 8 years, is segmented.
Consider charts with time frames: 10 years, 13 years, 21 years, 34 years.
3.1.6. Time frame chart of 10 years, 13 years, 21 years and 34 years.
The dynamics of the Dow Jones index values from 1896 to June 2021 on a chart with time frames: 10 years, 13 years, 21 years, 34 years.
For time frames 10 years old, 13 years old, 21 years old, and 34 years old, two graphs are plotted each.
For chart # 1 with a time frame of 10 years, the start period will be the time interval [1, 10], then [11, 20], [21, 30], [31, 40], etc.
For chart # 6 with a time frame of 10 years, the start period will be the time interval [6, 15], then [16, 25], [26, 35], [36, 45], etc.
For chart # 1 with a time frame of 13 years, the start period will be the time interval [1, 13], then [14, 26], [27, 39], [40, 52], etc.
For chart No. 9 with a time frame of 13 years, the start period will be the time interval [9, 21], then [22, 34], [35, 47], [48, 60], etc.
For chart # 1 with a time frame of 21 years, the start period will be the time interval [1, 21], then [22, 42], [43, 63], [64, 84], etc.
For chart No. 17 with a time frame of 21 years, the start period will be the time interval [17, 37], then [38, 58], [59, 79], [80, 100], etc.
For chart # 1 with a 34 years time frame, the start period will be the time interval [1, 34], then [35, 68], [69, 102], [103, 136], etc.
For chart # 30 with a 34 years time frame, the start period will be the time interval [30, 63], then [64, 97], [98, 131], [132, 165], etc.
Graph # 1 for time frames of 10 years, 13 years, 21 years and 34 years shows the dynamics, which corresponds to the generally accepted time calculation.
Chart 6 for a time frame of 10 years, chart no. 9 for a time frame of 13 years, chart no. 17 for a time frame of 21 years and chart no. 30 for a time frame of 34 years show the dynamics, which corresponds to the time period from 5 years to ours. era.
The fractal structure, which is displayed on the above charts, is the same and is the same for all charts.
Building charts with different time frames and analyzing the fractal structure on each of them makes it easy to determine the cost and time intervals of fractals.
The fractal structure of charts, which are built with time frames: 10 years, 13 years and 21 years, is segmented, and on a chart with a 34 years time frame, the fractal structure is a mono segment.
3.1.7. Determining the order of fractals.
A holistic picture of the segmentation of the fractal structure of the Dow Jones index chart in the time interval from 1896 to June 2021 can be seen on the charts with time frames in years: 1, 2, 3, 5, 8, 10, 13, 21 and 34, which are plotted by logarithmic index values.
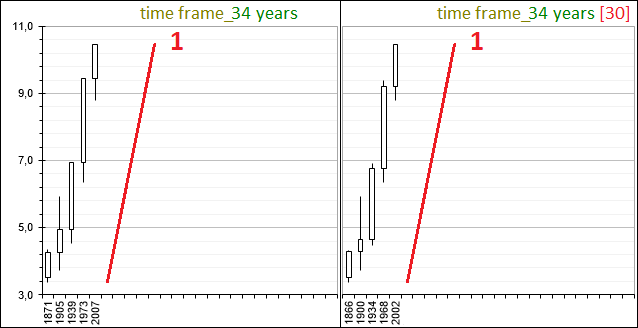
This mono segment is currently the highest order fractal. Let's assume that this is the first segment of a fractal of an even higher order. Let's designate it as 1.
In this case, the construction of a fractal structure in dynamics in the time interval from 1896 to June 2021 can be described by fractals of the following orders.
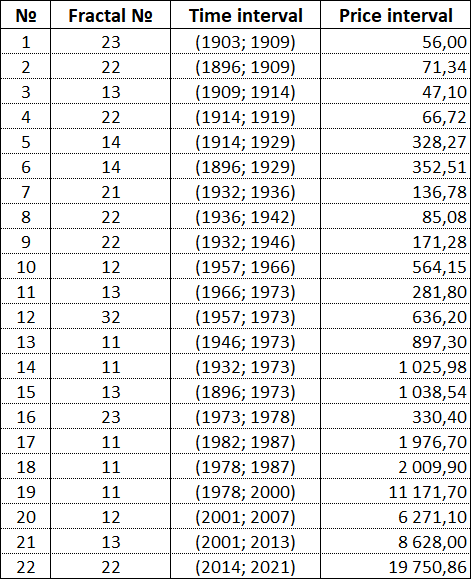
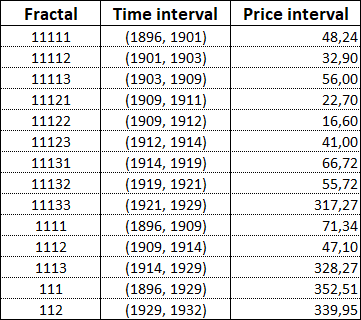
On the chart with a time frame of 1 year, in the time interval from 1896 to 2021, 22 completed fractals are indicated, which are segmented.
1. Fractal F11113 is a 5th order fractal, it consists of segments: F111131, F111132, F111133, which are 6th order fractals and is Fractal No. 23 from the Niro alphabet:
F11113 ≡ F23.
Time interval T11113 - (1903, 1909).
Price interval P11113 = 56.00.
2. Fractal F1111 is a fractal of the 4th order, it consists of segments: F11111, F11112, F11113, which are fractals of the 5th order and is Fractal No. 22 from the Niro alphabet:
F1111 ≡ F22.
Time interval T1111 - (1896, 1909).
Cost interval P1111 = 71.34.
3. Fractal F1112 is a fractal of the 4th order, it consists of segments: F11121, F11122, F11123, which are fractals of the 5th order and is Fractal No. 13 from the Niro alphabet:
F1112 ≡ F13.
Time interval T1112 - (1909, 1914).
Cost interval P1112 = 47.10.
4. Fractal F11131 is a 5th order fractal, consists of segments: F111311, F111312, F111313, which are 6th order fractals and represents Fractal No. 22 from the Niro alphabet:
F11131 ≡ F22.
Time interval T11131 - (1914, 1919).
Cost interval P11131 = 66.72.
5. Fractal F1113 is a fractal of the 4th order, consists of segments: F11131, F11132, F11133, which are fractals of the 5th order and is Fractal No. 14 from the Niro alphabet:
F1113 ≡ F14.
Time interval T1113 - (1914, 1929).
Cost interval P1113 = 328.27.
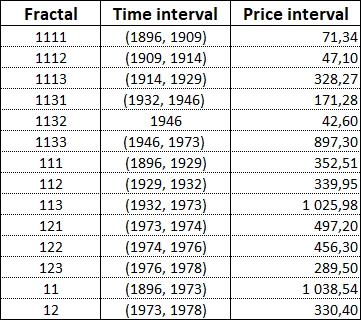
6. Fractal F111 is a fractal of the 3rd order, it consists of segments: F1111, F1112, F1113, which are fractals of the 4th order and is Fractal No. 14 from the Niro alphabet:
F111 ≡ F14 ≡ FS {F22, F13, F14}.
Time interval T111 - (1896, 1929).
Cost interval P111 = 352.51.
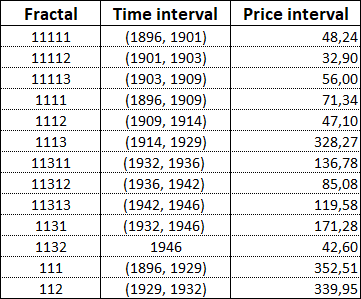
7. Fractal F11311 is a 5th order fractal, consists of segments: F113111, F113112, F113113, which are 6th order fractals and is Fractal No. 21 from the Niro alphabet:
F11311 ≡ F21.
Time interval T11311 - (1932, 1936).
Cost interval P11311 = 136.78.
8. Fractal F11312 is a 5th order fractal, it consists of segments: F113121, F113122, F113123, which are 6th order fractals and is Fractal No. 22 from the Niro alphabet:
F11312 ≡ F22.
Time interval T11312 - (1936, 1942).
Cost interval P11312 = 85.08.
9. Fractal F1131 is a fractal of the 4th order, consists of segments: F11311, F11312, F11313, which are fractals of the 5th order and is Fractal No. 22 from the Niro alphabet:
F1131 ≡ F22.
Time interval T1131 - (1932, 1946).
Cost interval P1131 = 171.28.
10. Fractal F113331 is a 6th order fractal, it consists of segments: F1133311, F1133312, F1133313, which are 7th order fractals and is Fractal No. 12 from the Niro alphabet:
F113331 ≡ F12.
Time interval T113331 - (1957, 1966).
Cost interval P113331 = 564.15.
11. Fractal F113333 is a 6th order fractal, consists of segments: F1133331, F1133332, F1133333, which are 7th order fractals and is Fractal No. 13 from the Niro alphabet:
F113333 ≡ F13.
Time interval T113333 - (1966, 1973).
Cost interval P113333 = 281.80.
12. Fractal F11333 is a 5th order fractal, consists of segments: F113331, F113332, F113333, which are 6th order fractals and is Fractal No. 32 from the Niro alphabet:
F11333 ≡ F32 ≡ FS {F12, MS, F13}.
Time interval T11333 - (1957, 1973).
Cost interval P11333 = 636.20.
13. Fractal F1133 is a fractal of the 4th order, it consists of segments: F11331, F11332, F11333, which are fractals of the 5th order and is Fractal No. 11 from the Niro alphabet:
F1133 ≡ F11 ≡ FS {F11, MS, F32}.
Time interval T1133 - (1946, 1973).
Cost interval P1133 = 897.30.
14. Fractal F113 is a fractal of the 3rd order, it consists of segments: F1131, F1132, F1133, which are fractals of the 4th order and is Fractal No. 11 from the Niro alphabet:
F113 ≡ F11 ≡ FS {F22, MS, F11}.
Time interval T113 - (1932, 1973).
Cost interval P113 = 1025.98.
15. Fractal F11 is a fractal of the 2nd order, consists of segments: F111, F112, F113, which are fractals of the 3rd order and is Fractal No. 13 from the Niro alphabet:
F11 ≡ F13 ≡ FS {F14, MS, F11}.
Time interval T11 - (1896, 1973).
Cost interval P11 = 1038.54.
16. Fractal F12 is a fractal of the 2nd order, consists of segments: F121, F122, F123, which are fractals of the 3rd order and is Fractal No. 23 from the Niro alphabet:
F12 ≡ F23.
Time interval T12 - (1973, 1978).
Cost interval P12 = 330.40.
17. Fractal F13113 is a 5th order fractal, it consists of segments: F131131, F131132, F131133, which are 6th order fractals and is Fractal No. 11 from the Niro alphabet:
F13113 ≡ F11.
Time interval T13113 - (1982, 1987).
Price interval P13113 = 1976.70.
18. Fractal F1311 is a fractal of the 4th order, it consists of segments: F13111, F13112, F13113, which are fractals of the 5th order and is Fractal No. 11 from the Niro alphabet:
F1311 ≡ F11.
Time interval T1311 - (1978, 1987).
Price interval P1311 = 2009.90.
19. Fractal F131 is a fractal of the 3rd order, consists of segments: F1311, F1312, F1313, which are fractals of the 4th order and is Fractal No. 11 from the Niro alphabet:
F131 ≡ F11 ≡ FS {F11, MS, F11}.
Time interval T131 - (1978, 2000).
Cost interval P131 = 11171.70.
20. Fractal F13311 is a 5th order fractal, it consists of segments: F133111, F133112, F133113, which are 6th order fractals and is Fractal No. 12 from the Niro alphabet:
F13311 ≡ F12.
Time interval T13311 - (2001, 2007).
Cost interval P13311 = 6271.10.
21. Fractal F1331 is a fractal of the 4th order, it consists of segments: F13311, F13312, F13313, which are fractals of the 5th order and is Fractal No. 13 from the Niro alphabet:
F1331 ≡ F13.
Time interval T1331 - (2001, 2013).
Cost interval P1331 = 8628.00.
22. Fractal F13331 is a fractal of the 5th order, consists of segments: F133311, F133312, F133313, which are fractals of the 6th order and is Fractal No. 22 from the Niro alphabet:
F13331 ≡ F22.
Time interval T13331 - (2014, 2021).
Price interval P13331 = 19750.86.
In the fractal structure, as of the end of June 2021, the highest order fractal that ended is the 5th order fractal F13331.
The 4th order fractal F1333, the 3rd order fractal F133, the 2nd order fractal F13 and the 1st highest order fractal F1 are incomplete and continue to form.
Taking into account the emerging local fractal structure, it can be assumed that within the time interval (1978, 2035), the four fractals indicated above will complete their formation simultaneously in 2035: F1333, F133, F13, F1.
1. Fractal F1333 is a fractal of the 4th order, it consists of segments: F13331, F13332, F13333, which are fractals of the 5th order and can be Fractal No. 23 from the Niro alphabet:
F1333 ≡ F23.
Forecasted time interval T1333 - (2014, 2035).
Forecasted cost interval P1333 = 19750.86.
2. Fractal F133 is a fractal of the 3rd order, it consists of segments: F1331, F1332, F1333, which are fractals of the 4th order and can be Fractal No. 11 from the Niro alphabet:
F133 ≡ F11 → FS {13, MS, 23}.
Forecasted time interval T133 - (2001, 2035).
Forecasted cost interval P133 = 27164.66.
3. Fractal F13 is a fractal of the 2nd order, consists of segments: F131, F132, F133, which are fractals of the 3rd order and can be Fractal No. 11 from the Niro alphabet:
F13 ≡ F11 → FS {11, MS, 11}.
Forecasted time interval T13 - (1978, 2035).
Forecasted cost interval P13 = 34354.76.
4. Fractal F1 is a fractal of the highest 1st order, consists of segments: F11, F12, F13, which are fractals of the 2nd order and can be Fractal # 11 from the Niro alphabet:
F1 ≡ F11 → FS {13, 23, 11}.
Forecasted time interval T1 - (1896, 2035).
Forecasted cost interval P1 = 35,062.90.
The 5th order fractal F13331 began to form in October 2014 and finished forming in May 2021. F13331 is the 1st segment of the 4th order fractal F1333, after the completion of which the fractal F13332 will begin to form, which is the 2nd segment of the F1333 fractal, and then the F13333 fractal, which is the 3rd segment of the F1333 fractal.
The second segment F13332 of the fractal F1333, having begun to form in May 2021, may complete its formation in 2028. As part of the formation of the F13332 fractal, the Dow Jones index values may fall by 2028 to the level of 16,000 points.
The 3rd segment F13333 of the fractal F1333 can form in the time interval from 2028 to 2035. As part of the formation of the fractal F13333, the Dow Jones index values may rise again from the 16,000 point mark to the 36,000 point mark.
Fractals F13333, F1333, F133, F13 are the third fractal segments in which the order of each subsequent fractal is one order higher than the previous one.
With the completion of the 5th order fractal F13333, the simultaneous completion of the 4th order fractal F1333 and the 3rd order fractal F133 and the 2nd order fractal F13 and the highest 1st order fractal F1 will occur.
The 2nd order fractal F11 is the 1st segment of the highest 1st order fractal F1. F11 formed in the time interval from 1896 to 1973.
The 2nd order fractal F12 is the 2nd segment of the highest 1st order fractal F1. F12 formed over the time frame from 1973 to 1978.
The 2nd order fractal F13 is the 3rd segment of the highest 1st order fractal F1. F13 will form in the time interval 1976 to 2035.
Thus, the attractor of the fractal structure FS {13, 23, 11} of the Dow Jones index graph is the F11 fractal - fractal No. 11 from the Niro alphabet, which is of the 1st type and belongs to the 1st type.
Completion of the F13 fractal in 2035 will complete the F1 fractal. Thus, the cycle of growth in the Dow Jones index, which began in 1896, will end.
In 2035, a global downtrend will begin in the American stock market. The fall in quotations of American stocks may be so strong that the value of the Dow Jones index will drop to the level of 2700 points. This decline will take place within the formation of the highest order fractal F2, which is the second segment in the global fractal structure.
3.2. Analysis of US macroeconomic indicators.
3.2.1. Fractal analysis and fundamental analysis as a single analysis.
The financial market is a nonlinear dynamic additive synergetic system (NDASS). The dynamics of value in the financial market is ordered, not chaotic, and, as the dynamics of a nonlinear system, is described by dynamic fractals determined by time series, which consist of the values of financial assets.
The orderliness of dynamics is manifested in the patterns of its development, expressed in the sequential formation of dynamic fractals on the graph, which are described in the Niro Alphabet, in strict accordance with the global fractal attractor. The price change graph is a fractal structure.
The construction of a fractal structure is described by the Niro Law, according to which a fractal structure is a fractal and consists of fractals, which are the simplest oscillatory movements, consisting of three segments with a different order, in accordance with which fractals of a smaller order form fractals of a larger order, that is, fractals of a smaller order are segments of higher order fractals.
This Law is unshakable. The simplest vibration is described by three successive movements (segments): the first and third have the same direction, and the second - the opposite.
Everything is predetermined. The first segment of a fractal is always followed by a second segment, the second segment is always followed by a third segment, and the third segment is always followed by the first segment of another fractal. All this generates a certain ORDER in a nonlinear system.
The sequential formation of fractal segments and the sequential alternation of fractals are predetermined, but not their view and type, which depend on external influences that generate CHAOS in the nonlinear system.
The completion of one segment of the fractal in certain cost and time intervals indicates an imminent trend change in dynamics and the beginning of the formation of another segment, the cost and time intervals of which are not known in advance since they depend on external circumstances (effects on the system), but are predetermined by the types and types of previous ones. fractals.
External influences on a nonlinear system are normal and abnormal.
Normal influences are such influences on a system in which the dynamics of this system is described by an attractor tending to the basic fractal F22 from the Niro alphabet (view 2, type 2).
Abnormal influences on the system lead to deformation of the segments of the basic fractal attractor, as a result of which the dynamics of the system is described by the attractor, which tends to one of the other 14 fractals from the Niro alphabet.
Macroeconomic indicators allow assessing external influences on the dynamics of the financial market.
Fractal analysis of charts of financial assets does not give a complete and clear picture of what is happening in the financial market without taking into account the processes taking place in world politics and the world economy. Only technical analysis supplemented by fundamental analysis allows us to model the future dynamics of value in the financial market.
Analysis of the fractal structure of the chart in order to determine the cost and time intervals of future fractals must be carried out in parallel with the analysis of the dynamics of macroeconomic indicators.
The dynamics of the financial market in the last century was determined by two events - the adoption of the Bretton Woods Agreement in 1944 and the subsequent adoption of the Jamaican Agreement in 1976.
The Second World War ruined all the leading states of the world, except for the United States, which enriched themselves in the war, rapaciously seizing huge capital. The United States, on whose territory there were no hostilities, and the economy was actively and rapidly developing without any competition from other states, traded with the rest of the world, including with the belligerent states, charging payment for the supplied weapons, goods and food exclusively gold. From the war-torn territories, financial capital flowed to America. With each year of the war, the appetite for enrichment at the expense of the impoverishment of the rest of the world in the United States only grew. When the end of the war became obvious and close, and no one was able to resist America either militarily or economically, the question of the subordination of the entire World to its economic (political) interests became in the United States.
In July 1944, the United States held a conference in Bretton Woods and, as the most powerful state in the world (10 years ago, decrepit, weak, in an economic depression), possessing the largest reserves of gold (approximately 70% of the world's reserves), canceling the existing financial system by “gold standard ”created and placed under their control a new global financial system, according to which:
• the gold price was fixed at 35 USD per troy ounce;
• exchange rates for other currencies were established against the US dollar.
The United States declared its dollar convertible into gold at a fixed rate and made it a means of international settlement.
Three decades later, the economies of the states destroyed by the war were restored and in the person of the Russian World there appeared a Force capable of competing with the United States in the economy and destroying them in the event of a military conflict. The sole dominance of the United States over the World disappeared and the Bretton Woods financial system ceased to correspond to the interests of the United States.
In 1976, the United States held a new conference in Jamaica and canceled the Bretton Woods Agreement. In the new international monetary system, the United States also placed itself over other states in a dominant position, allowing the entire world to dictate its will through the established international financial institutions.
The Jamaican monetary system was formed during 1976-1978 on the following basic principles:
• the fixed price of gold against the US dollar was canceled and determined by market mechanisms;
• exchange rates against the US dollar were determined by the foreign exchange market.
Let's analyze the fractal structure of the Dow Jones index chart through the prism of the following important events:
1. on the eve of the Great Depression, which began in 1929;
2. Bretton Woods Conference in 1944;
3. Jamaican Conference in 1976,
and analyze the dynamics of US macroeconomic indicators on the eve of the Jamaican Conference.
3.2.1.1. Analysis of the fractal structure of the Dow Jones index chart on the eve of the Great Depression that began in 1929.
Analysis of the fractal structure of the Dow Jones index chart on the time interval (1896, 1929) shows that a third-order fractal F111 has formed on this interval, which is the 1st segment of the second-order fractal F11.
This fact suggests that the growth of the index values in the time interval from 1896 to 1929 has ended and the uptrend should be replaced by a downtrend within the formation of the third order fractal F112, which is the second segment in relation to the third fractal order F111.
In the case of normal external influences, a third-order fractal F112 with fourth-order segments F1121, F1122, F1123 should be formed in the form of a basic fractal attractor F22, the time and cost intervals of which should be 61.8% of the time and cost intervals of fractal 3th order F111.
In this case, the downtrend in the Dow Jones index should end in 1949 at around 160 points.
However, taking into account the unfavorable situation in the US economy, within the framework of the formation of the third order fractal F112, the downtrend was so strong that it lowered the index values to the 40-point mark by 1932.
The third-order fractal F112 formed with the time interval T112 (1929, 1932) and the cost value P112 = 339.95 points in the form of a mono-segment.
Completion of the 3rd order fractal F112, which is the 2nd segment of the 2nd order fractal, completed the downtrend. This fact suggests that the subsequent dynamics of the Dow Jones index values will be upward as part of the formation of the 3rd order fractal F113, which is the 3rd segment in relation to the 3rd order fractals F111 and F112.
An analysis of the fractal structure of the Dow Jones index chart, together with an analysis of the ongoing processes in the global economy and politics of the mid-30s of the last century, allows us to assess not only the current state of affairs in the US economy, but also to see the directions of future trends in the stock market and even their duration.
3.2.1.2. Analysis of the fractal structure of the Dow Jones index chart on the eve of the Bretton Woods conference in 1944.
The economic crisis that began in the United States in 1929 could have dragged on for more than a decade, and the downtrend in the American stock market as part of the formation of the third order fractal F112 could have roughly ended in 1949.
However, this did not happen because of Germany, which, with the connivance of Great Britain and France, started a war in Europe.
The irresponsible policy of the victors in the First World War of Great Britain and France, carried out against Germany humiliated by the results of this war, as well as the weakness, betrayal and cowardice of the leadership of Great Britain and France to repulse the presumptuous German fascism, manifested in the Munich agreement in 1938, by refusing to conclude with the Russians anti-fascist alliance and pushing the Germans to war with the Russians, led to the Second World War.
In world politics and economics, a situation has developed that allowed the United States to very quickly get out of the terrible economic crisis in a short time at the expense of the rest of the states destroyed by the war.
Analysis of the fractal structure of the Dow Jones index chart on the time interval (1932, 1946) shows that the 4th order fractal F1131 has formed on this interval, which is the 1st segment of the 3rd order fractal F113.
This fact suggests that the growth of the index values has ended and the uptrend should be replaced by a downtrend within the formation of the 4th order fractal F1132, which is the 2nd segment in relation to the 4th order fractal F1131.
In the case of normal external influences, a 4th order fractal F1132 with 5th order segments F11321, F11322, F11323 should be formed in the form of a basic fractal attractor F22, the time and cost intervals of which should be 61.8% of the time and cost intervals of fractal 4th order F1131.
In this case, the downtrend in the Dow Jones index should end in 1954 around 110 points. However, no significant decline has occurred.
The absence of competition in the market during the war period and the enormous demand from the war-torn states for all groups of goods produced in the United States, for which the United States was charged in gold, allowed the US economy to develop rapidly.
1944 year. The Second World War continues, but its end is visible and the outcome is clear. Therefore, in July 1944 at Bretton Woods, the United States abolished the "gold standard", announced the "gold dollar standard" and made its national currency world money instead of gold, starting the era of the US dollar's dominance.
1945 year. The United States is the most powerful power in economic and military terms. The US economy is growing, the capitalization of the stock market is increasing and it is impossible to imagine any reasons for its decline against the background of the completion of the 4th order fractal F1131.
However, in 1946, the Dow Jones stock index decreased as part of the formation of the 4th order fractal F1132, which is the 2nd segment in relation to the 4th order fractal F1131.
Fractal F1132, which began in 1946, ended in the same year, giving rise to the formation of the 4th order fractal F1133, which is the 3rd segment in relation to the 4th order fractals F1131 and F1132.
In the middle of the last century, the US stock market has excellent growth prospects as part of the formation of the 4th order fractal F1133, which is the 3rd segment of the 3rd order fractal F113.
3.2.1.3. Analysis of the fractal structure of the Dow Jones index chart on the eve of the Jamaican conference in 1976.
US companies operate and receive profits, part of which is used to pay dividends on shares, the other part - to increase capital, thereby helping to increase their market capitalization, i.e. growth of quotations of their shares on the stock market.
An increase in the value of a company's shares, corresponding to an increase in its capital, taking into account the rate of dividend yield, is fair growth. Otherwise, growth is unfair - either speculative, inflationary, or worse, both.
In the time interval from 1944 to 1978, between the Bretton Woods and Jamaican Accords, the rise in the US stock market was fair. The subsequent growth in the capitalization of US companies became speculative, and then, in addition, inflationary.
Analysis of the fractal structure of the Dow Jones index chart on the time interval (1946, 1973) shows that on this time interval between Bretton Woods and Jamaica, a fractal of the 4th order F1133 was formed in the fractal structure of the Dow Jones stock index chart, which is the 3rd segment fractal of the 3rd order F113, which in turn is the 1st segment of the fractal of an even larger 2nd order F11.
This fact suggests that the growth of the Dow Jones index values in the interval from 1896 to 1973 ended, as the second order fractal F11 with segments of the third order fractals F111, F112 and F113 ended.
The fractal of the 2nd order F11 is the 1st segment of the fractal of an even larger 1st order F1. With the completion of the 1st segment of F11, the 2nd segment of F12 begins to form, which has the opposite direction.
It is within the framework of the formation of the F12 fractal that the downward dynamics of the Dow Jones index will begin in 1973.
In the case of normal external influences, a second order fractal F12 with segments of the third order F121, F122, F123 should be formed in the form of a basic fractal attractor F22, the time and cost intervals of which should be 61.8% of the time and cost intervals of fractal 2th order F11.
In this case, the downtrend of the Dow Jones index values, which began in 1973, should end in 2020 at around 400 points. However, there was no significant decline again.
The 2nd order fractal F12 was formed with the time interval T12 (1973, 1978) and the value P12 = 330.40 points in the form of the F23 fractal from the Alphabet of Niro Attractors.
The large-scale correction of the US stock market, which could have ended approximately in 2020, was prevented from happening by the so-called Jamaican Monetary System, created by the United States in 1976-1978.
In 1976, the United States again, as in 1944, guided by its selfish economic (political) interests, subjugated the world financial system.
From 1945 to 1960, the world economy grew primarily due to the growth of the US economy. The growth of the commodity supply demanded from the United States an increase in the money supply to ensure trade turnover and further economic growth.
The US launched a printing press declaring to the world that the US dollar was backed by gold and that at the rate of 35 USD per troy ounce, US dollars could be exchanged for gold at any time in any volume.
The emission of dollars in exchange for the US promises to convert them into gold at a fixed rate was well received by the world economy. The world community had no choice but to believe in the empty promises of the United States.
Consider the dynamics of the US macroeconomic indicators before the violation of its obligations to convert dollars into gold at a fixed rate of 35 USD per troy ounce.
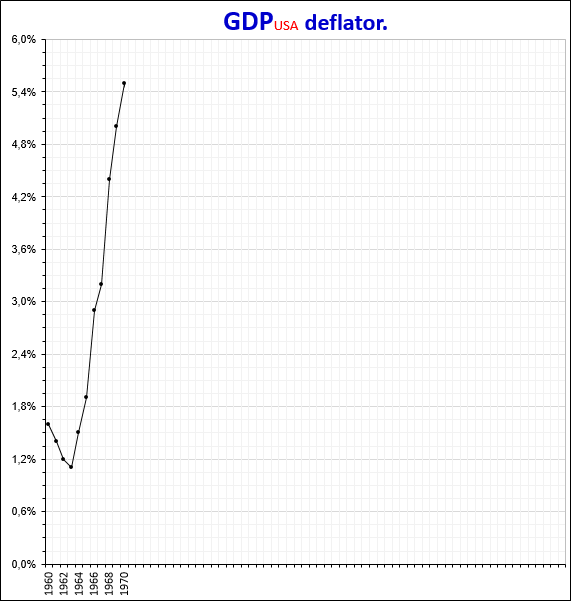
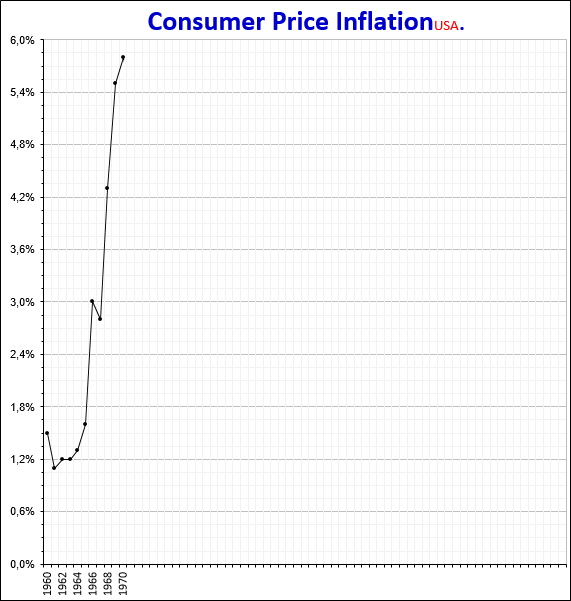
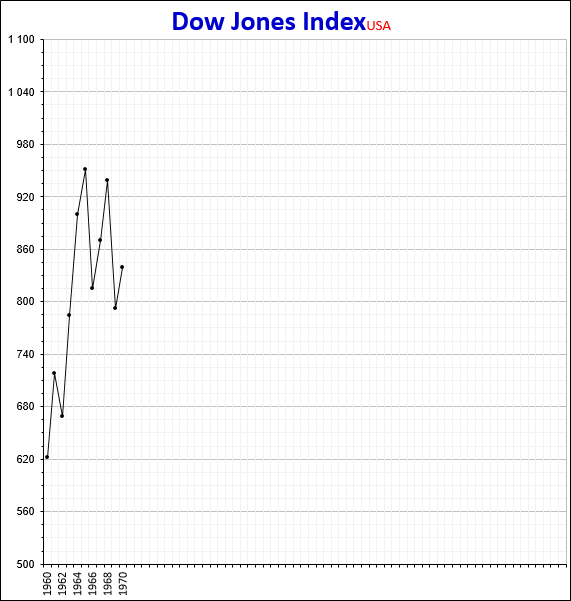
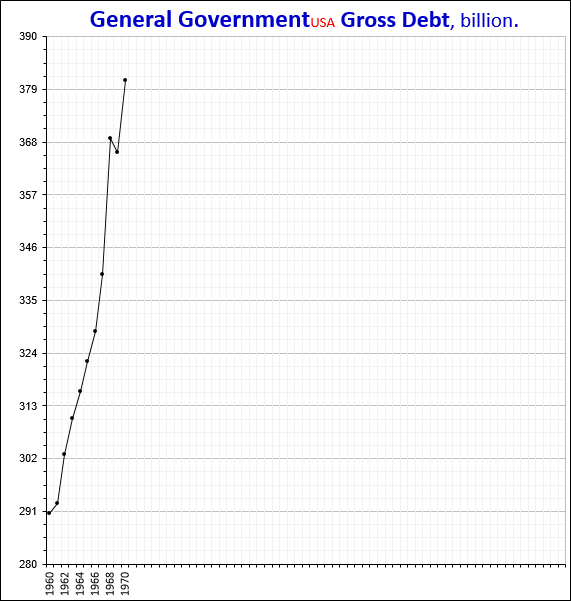
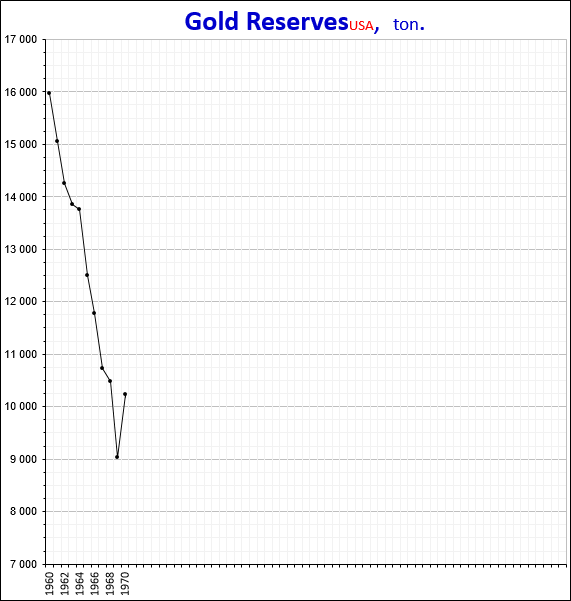
3.2.1.4. Analysis of macroeconomic indicators of the US economy over time (1960, 1970).
Dynamics of US macroeconomic indicators in the time interval from 1960 to 1970.
1. Gross domestic product (GDP);
2. GDP deflator;
3. Consumer price inflation;
4. Market capitalization (MC);
5. General government gross debt (GGGD);
6. Gold reserves (GR);
7. GGGD vs GDP.
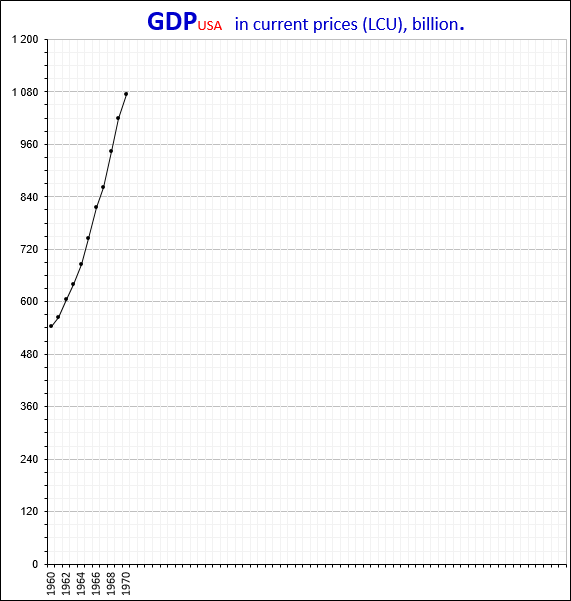
The United States does not have its own raw material base sufficient to maintain high growth rates of its economy, so they have to import raw materials. The cost of imported raw materials is a key issue for the development of the economy.
The United States understood that the growth of an economy focused on importing raw materials would be accompanied by an increase in hard-to-control inflation, devaluing the income received and holding back development.
From 1960 to 1970, US GDP growth averaged 10% per year was accompanied by an increase in inflation from 1% to almost 6%. The continued development of the economy in the same vein promised an increase in inflation to double-digit values.
In the USA, they understood that raw materials for their economy should be cheap and figured out how to make them free for themselves at all, ensuring GDP growth and income growth with the lowest possible inflation rate.
Keeping gold in locked vaults will not make you very rich, and in the United States another plan of enrichment has matured at the expense of the rest of the World.
Giving some gold in exchange for dollars is not insanity on the part of the United States, but a clear and well-thought-out move.
By reducing its gold reserves by a third, the United States has demonstrated to the world community its alleged commitment to continue to provide the US dollar with gold. Having returned almost 6 tons of gold to the world, the United States intended to take back much more.
5.7 tons of gold, for which reserves have decreased, is the US investment in its national currency, which should bring profit hundreds of times more than spent.
The American dollar turned out to be a fishing rod in the hands of the United States, on which the whole World was caught, and 5.7 tons of gold is the bait on the hook, which the whole World swallowed.
By reducing its gold reserves for future enrichment at the expense of the rest of the World, the United States has set itself the consistent achievement of the following goals:
1) Make the US dollar a non-alternative currency in international settlements;
2) To finally form and consolidate the world payment system in the US dollar, as the only currency convertible into gold at a fixed rate;
3) Withdraw from the obligations under the Bretton Woods Agreement to exchange US dollars for gold at a fixed rate of 35 USD per troy ounce;
4) Provide unlimited and uncontrolled emission of the US dollar;
5) Provide nothing for an unlimited increase in the US government debt, which acts as an adsorbent for sterilizing the dollar money supply;
6) Pay for absolutely everything and even more (your military campaigns) not with your earned money, but with printed green papers.
Obviously, the United States was able to achieve its goals only in a world in which there would be no states militarily stronger than the United States, with a strong economy, high incomes and a stable currency. Therefore, the United States began creating a powerful army and organizing military bases around the world, and directed its foreign policy to curb the development of other states, paying particular attention to geopolitics in relation to Heartland and the confrontation with the Russian World.
The Second World War showed that financial capital loves peace and stability. The United States planned to remain for the world financial capital as a "safe haven" by destabilizing the situation in different parts of the world by unleashing military conflicts and maintaining them at the required level of confrontation, which does not allow economic development of either the territories on which the hostilities were taking place or the territories bordering them.
The concept of hegemony of the US dollar stipulates that there should not be such a state in the internal affairs of which the United States could not intervene to destabilize either the economic or political situation in order to weaken this state.
In the absence of democracy and freedoms among its citizens within its state, the United States zealously began to “bring freedom and democracy” to citizens of other countries, bringing discord into their society and destroying the prevailing economic and political foundations, bringing chaos into all spheres of life. All this is done by the United States on the basis of subsequent interventions: stagnation of the national economy; defaults on government and corporate debts; hyperinflation; devaluation of the national currency; capital flight and citizens' savings from the national currency into the US dollar, disorientation and impoverishment of the population; civil war; the state's inability to fulfill its social obligations due to lack of funds and, at the end of all, it is obtaining loans from US-controlled international financial institutions on the terms of US admission to looting state assets.
A person is judged by his actions in the past. Knowledge of how a person behaved in certain circumstances and life situations allows you to get an idea of his morality, his values, his motivation, and understand what can be expected from this person in the future.
A group of people and even a state is judged in the same way. To understand the logic of US actions in the global world and to know what to expect from the US in politics, economics or in any other field of activity, it is necessary to know well the history of this state, its actions (for example, the use of nuclear weapons by the US against the civilian population of Japan).
The United States, for the most part, is not a story about a state, it is a story about how to deceive, how to seize, how to enslave, how to subjugate, how to get rich, using blackmail, threats, pressure and even crime.
Sources of super-profits for the United States are either cheap, or better free, raw materials, or cheap, and better free, labor, or both.
Immigrants from Western Europe, and then their subsequent descendants, starting with the exchange of beads for gold from the "Indians", then moving on to the genocide of the indigenous population of America and continuing to build a slave-owning system, organizing the United States of America and now continue to stay in the same paradigm, in all voice declaring to the whole world about their exclusivity and superiority over the peoples of the rest of the World. This is very sad, but you need to know that God is Love, God endures for a long time and will put an end to any lawlessness.
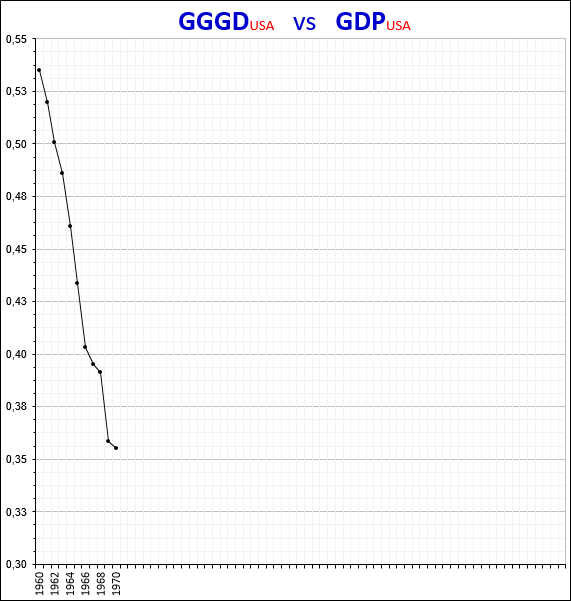
So, at the end of 1970, a fractal analysis of the dynamics of the Dow Jones index graph, as the dynamics of a nonlinear dynamic system, on a time interval (1896, 1970) showed that in 3 years in 1973 the second order fractal F11, which is 1-th segment of the 1st order fractal F1.
The downward dynamics of the index is predetermined by the Niro Law. In 1973, a downward corrective movement of the index should begin within the framework of the formation of the 2nd order fractal F12, which is the 2nd segment of the 1st order fractal F1.
The values of the future time and cost intervals of the three segments of the F12 fractal: F121, F122 and F123 are predetermined by external influences on the system.
Let us evaluate the external influences on the “Dow Jones Index” system by analyzing the dynamics of US macroeconomic indicators in the time interval from 1960 to 1980.
3.2.1.5. Analysis of macroeconomic indicators of the US economy over time (1960, 1980).
Dynamics of US macroeconomic indicators in the time interval from 1960 to 1980.
1. Gross domestic product (GDP);
2. GDP deflator;
3. Consumer price inflation;
4. Market capitalization (MC);
5. General government gross debt (GGGD);
6. Gold reserves (GR);
7. GGGD vs GDP.
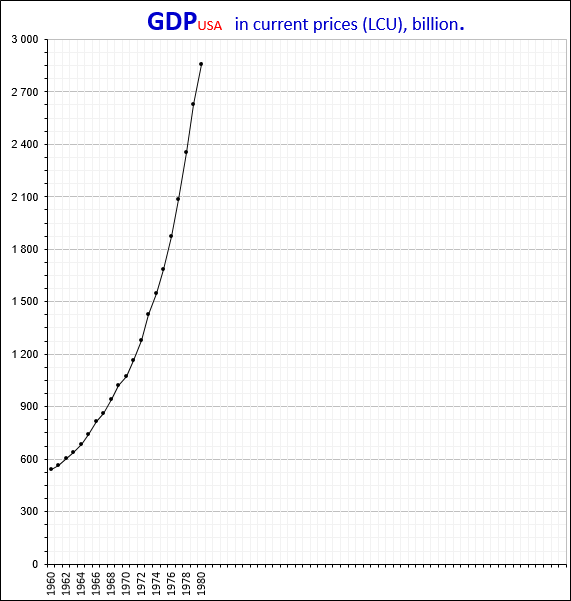

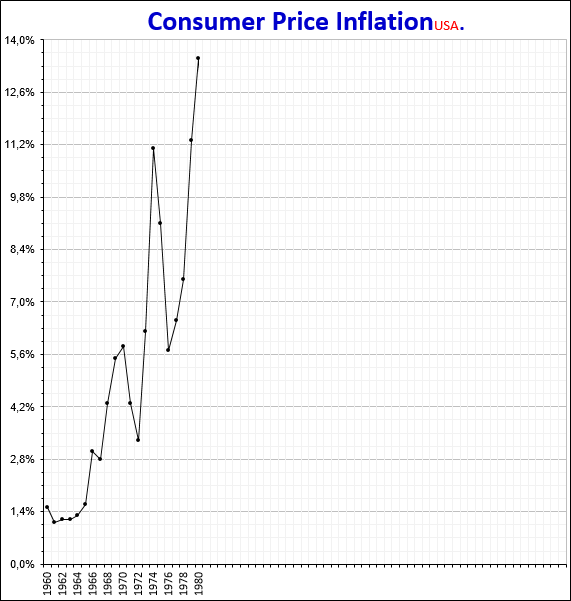
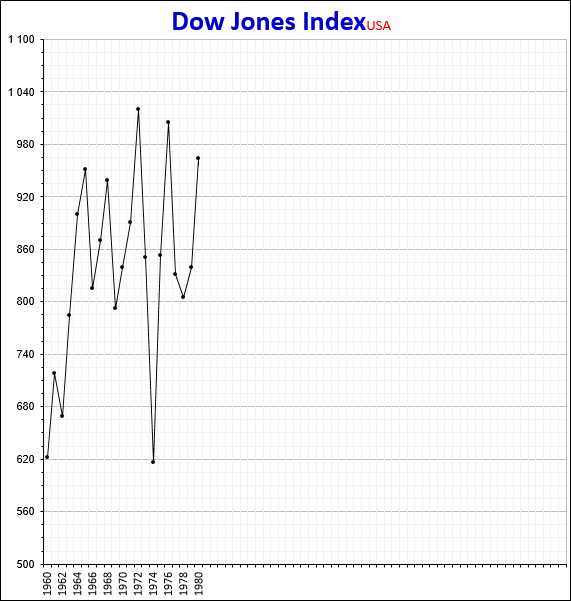
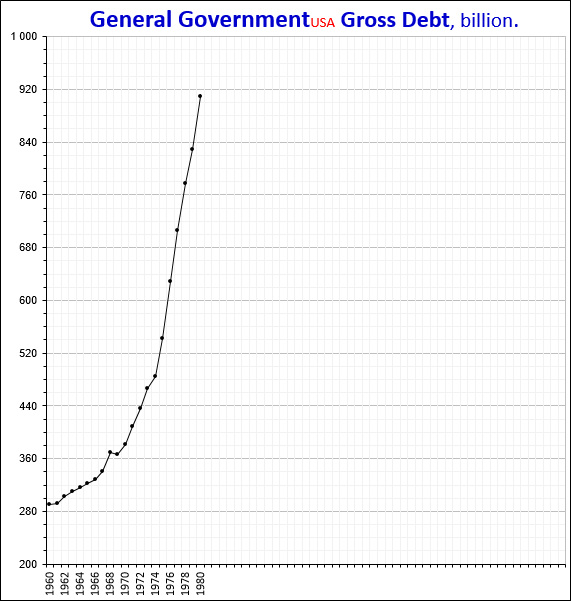
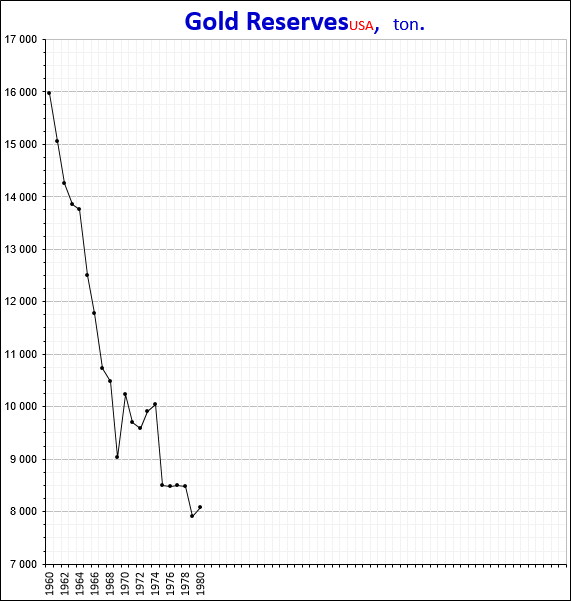
The United States was not going to continue to change the yellow metal for green paper.
From the point of view of the United States, 8'000 tons of gold spent over 20 years is not the price they paid to make their national currency a global means of payment, but an investment that must necessarily pay off in multiples.
The attempt on the hegemony of the US dollar is an attempt on 8'000 tons of gold, which the United States gave to the world community, from their point of view, on a returnable basis and which they do not intend to share with anyone.
With the loss of the US dollar of its hegemony, the US will lose much more - they will lose the opportunity to live in debt at the expense of the rest of the World.
Therefore, defending the hegemony of its dollar, the United States will kill and destroy, which it easily demonstrated to the world community by military aggression against sovereign states and the murder of their legitimate leaders who planned to undermine the hegemony of the US dollar by refusing to trade their countries' raw materials for US dollars.
It is important to know, no matter what lawlessness the United States is doing in the world, the hegemony of the dollar will be completed and the guarantor of this end is the Russian World, capable and, most importantly, ready to stop the reckless behavior of the United States by zeroing within an hour the military potential of the United States and, if necessary, themselves USA.
The United States is unlikely to push things to zero, because "Being the richest guy in a cemetery is not the funniest story."
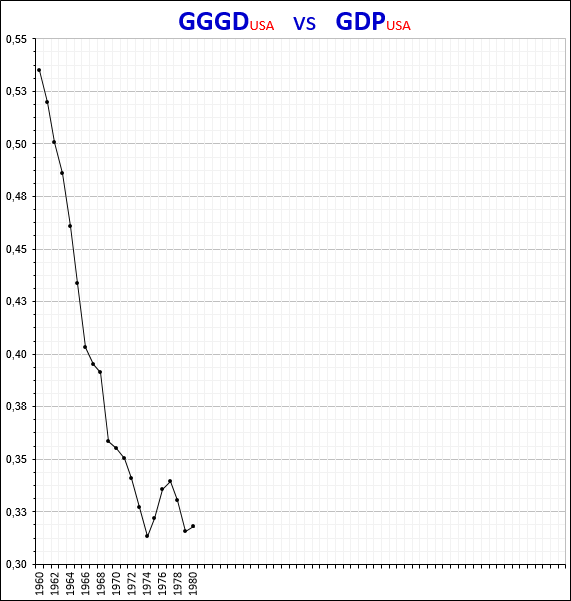
So, at the end of 1980, a fractal analysis of the dynamics of the Dow Jones index graph, as the dynamics of a nonlinear dynamic system, on a time interval (1896, 1980) showed that in 1973 the 2nd order fractal F11, which is the 1st segment of the fractal, ended. 1st order F1.
From 1973 to 1978, a fractal F23 (view 2, type 3) from the Alphabet Niro was formed in the fractal structure of the Dow Jones index chart.
Taking into account the fact that after securing the status of the world currency in US international settlements for the US dollar, having abandoned their obligations to the whole world under the Bretton Woods Agreement to exchange US dollars for gold at the rate of 35 US dollars per troy ounce, they provided for themselves the possibility of unlimited and uncontrolled emission of their dollar, one could safely assume that no downward dynamics in the US stock market should be expected.
In this case, the fractal formed on the time interval (1973, 1978) can be designated as a 2nd order fractal F12, which is the 2nd segment of the 1st order fractal F1.
The upward dynamics of the index is predetermined by the Niro Law, therefore, in 1978, the growth of the index values should begin as part of the formation of the 2nd order fractal F13, which is the 3rd segment of the 1st order fractal F1.
The values of the future time and cost intervals of the three segments of the F13 fractal: F131, F132 and F133 are predetermined by external influences on the system.
Let us evaluate the external influences on the Dow Jones Index system by analyzing the dynamics of US macroeconomic indicators 10 years after the Jamaican Conference.
3.2.1.6. Analysis of macroeconomic indicators of the US economy over time (1960, 1986).
Dynamics of US macroeconomic indicators in the time interval from 1960 to 1986.
1. Gross domestic product (GDP);
2. GDP deflator;
3. Consumer price inflation;
4. Market capitalization (MC);
5. General government gross debt (GGGD);
6. Gold reserves (GR);
7. GGGD vs GDP.
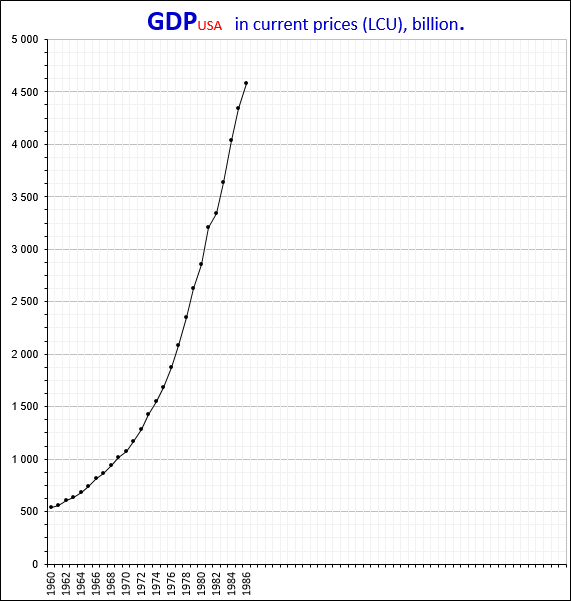
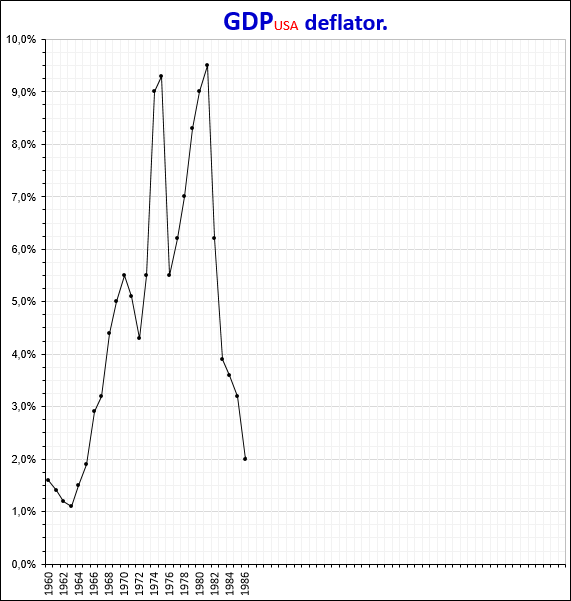
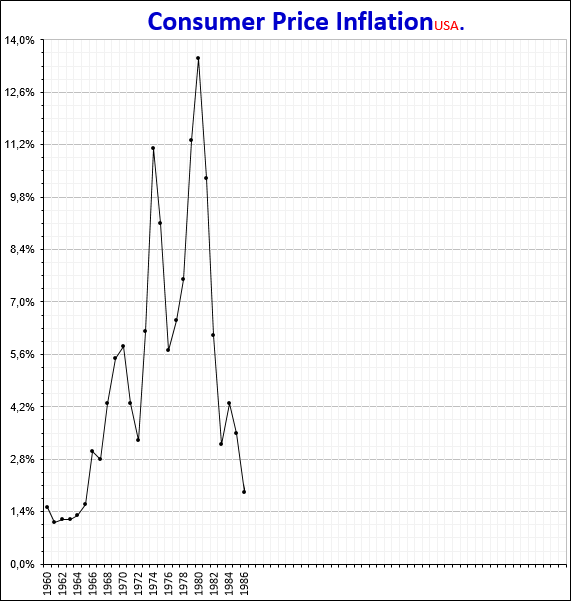
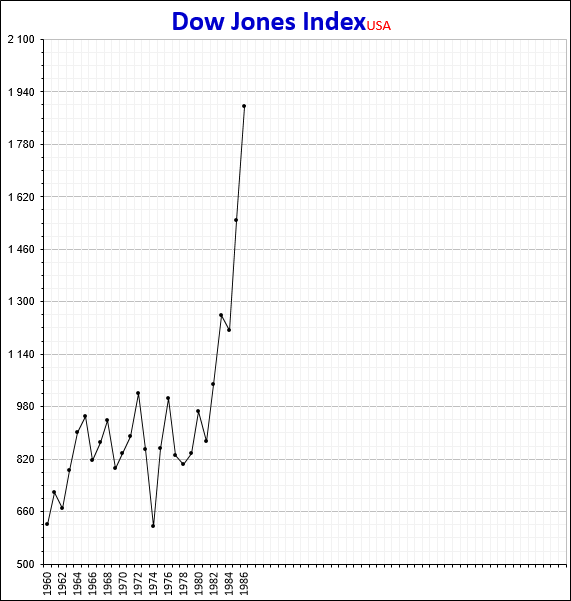
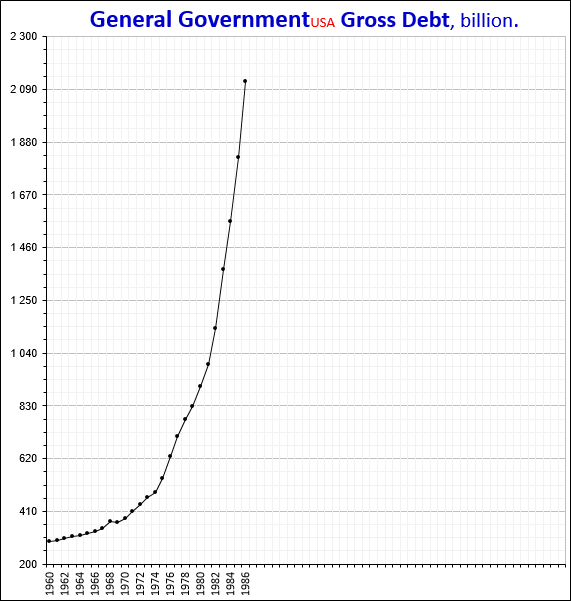
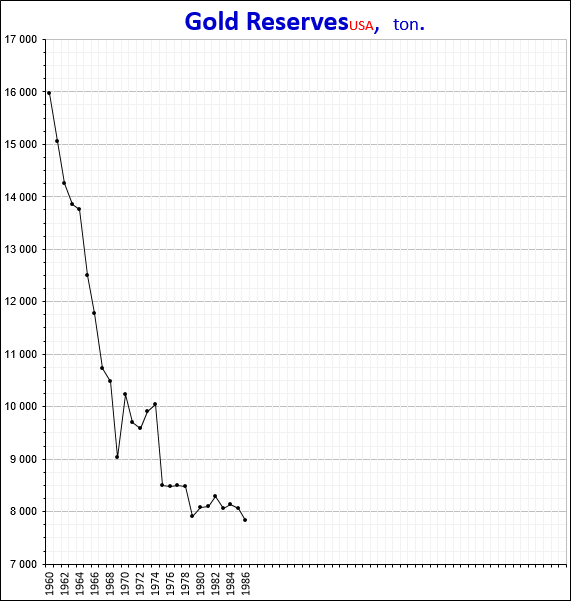
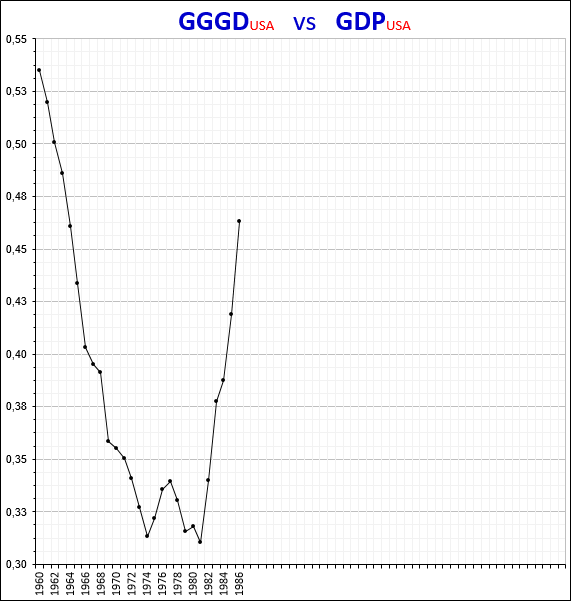
Thus, at the end of 1986, after analyzing the fractal structure of the Dow Jones index chart and fundamental economic analysis of the US economy and taking into account the situation that developed in the world economy and world finance in the mid-1980s, we can say with complete confidence that
1) in the fractal structure of the Dow Jones index chart in the time interval between 1896 and 1973 and in the cost interval between the value of 28.66 and the value of 1067.20, a fractal of the 2nd order F11 was formed (1st view, 3rd type from the Alphabet Niro), which is the 1st segment of the highest 1st order fractal F1:
F11 ≡ F13; T11 = 78 years; P11 = 1038.54 pips.
2) in the fractal structure of the Dow Jones index chart in the time interval between 1973 and 1978 and in the cost interval between the value of 1067.20 and the value of 736.80, a fractal of the 2nd order F12 was formed (of the 2nd view, 3rd type from the Alphabet Niro), which is the 2nd segment of the highest 1st order fractal F1:
F12 ≡ F23; T12 = 6 years; P12 = 330.40 pips.
3) in the fractal structure of the Dow Jones index chart on the time interval starting from 1978 and on the value interval starting from the value of 736.80 points, a fractal of the 2nd order F13 began to form, which is the 3rd segment of the fractal of the highest 1st order F1.
The irresponsible financial policy of the United States in relation to the world community, expressed, first of all, in the unlimited and uncontrolled, and therefore criminal, emission of the US dollar to excessively increase its public debt, which cannot be justified either economically or by common sense, has led to an unjustified growth of the market capitalization of companies, which turned the US stock market into a huge bubble.
The concept of the dividend yield of a company's stock (taking values from 0% to 0.1% per annum) has lost all economic sense. Making a profit on the stock market is based solely on speculation that accelerates the prices of shares, in which, by analogy with the commodity market, there is already an inflationary component.
The growth of the stock index values in the time interval from 1978 to 2021 by 4700% forms the hypertrophied 3rd segment of the F1 fractal in the fractal structure of the chart.
Taking into account the existing fractal structure on the Dow Jones index chart in June 2021, it can be assumed that on the time interval (2014; 2021) the 5th order fractal F13331, which is the 1st segment of the 4th order fractal F1333, completed and the formation began. the 5th order fractal F13332, which is the 2nd segment of the 4th order fractal F1333.
As part of the formation of fractal F13332, the dynamics of the US stock market will be downward and the Dow Jones index may drop from the values reached in June 2021 to 16'000 points by 2028.
After the completion of the fractal F13332, the formation of the 5th order fractal F13333, which is the 3rd segment of the 4th order fractal F1333, will begin.
As part of the formation of fractal F13333, the dynamics of the US stock market will be upward and the Dow Jones index may rise to the values that were reached in 2021 by 2035.
Let's consider the possibility of such future dynamics of the Dow Jones index, taking into account the dynamics of US macroeconomic indicators and taking into account the processes taking place in world politics and the world economy.
3.2.1.7. Analysis of macroeconomic indicators of the US economy over time (1960, 2020).
Dynamics of US macroeconomic indicators at the end of 2020.
1. Gross domestic product (GDP);
2. GDP deflator;
3. Consumer price inflation;
4. Market capitalization (MC);
5. General government gross debt (GGGD);
6. Total reserves (TR);
7. Gold reserves (GR);
8. Broad money (BM);
9. Exports;
10. Goods Exports;
11. Service Exports;
12. Imports;
13. Goods Imports;
14. Service Imports;
15. Current account balance;
16. GDP vs MC;
17. GGGD vs GDP;
18. BM vs GDP;
19. Exports vs GDP;
20. Exports vs MC;
21. TR vs GDP;
22. TR vs GGGD;
23. Gold Reserves in Total Reserves;
24. Goods Exports in Exports;
25. S ervices Exports in Exports;
26. Goods Imports in Imports;
27. Services Imports in Imports;
28. E xports vs Imports;
29. Goods Exports vs Goods Imports;
30. Services Exports vs Services Imports;
31. GDP & MC;
32. GDP & GGGD;
33. GDP & BM.
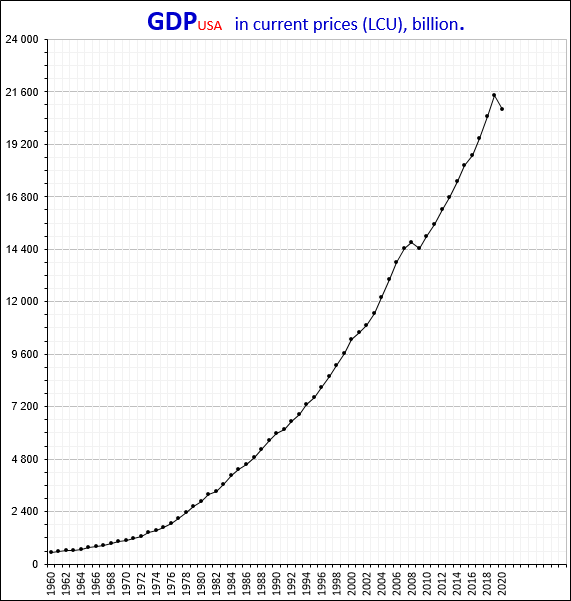
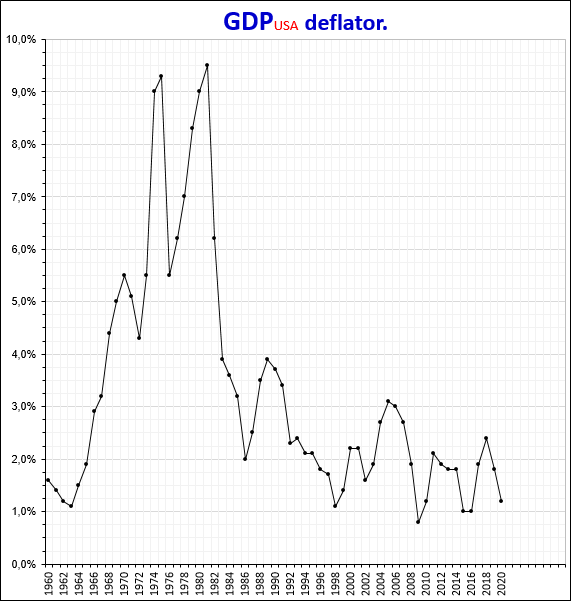

4. Market capitalization (Dow Jones stock index).

The unrestrained growth of the US national debt was caused by a natural reason - the weakening of the main geopolitical enemy - the Russian State.
Orthodox Christianity is the basis for the existence of the Russian World. The state of the Russian person outside Orthodoxy is his unnatural state, which makes him weak in all respects.
All unnatural states are unstable and always come to their end, being replaced by natural states that are stable.
The development of the Russian World within the framework of an atheistic state with a communist ideology could not be sustainable due to its unnaturalness. The collapse of such a state was a matter of time. And that time has come. One leader began the collapse of his state, and the other completed it. The state in which the society is, is always attached such a leader, which corresponds to this state.
One leader, led by vanity and greedy for the praise of flattering enemies, by his actions where not necessary and by his inaction where necessary, in every possible way contributed to the collapse of the state entrusted to him in government.
The head of state, who is proud and enjoys the title of honorary citizen of another state, who committed genocide against his people, who killed more than 27'000'000 compatriots, causes nothing but disgust. The absence of apologies and repentance for the harm done to one's homeland and shifting responsibility onto others, shows all the vileness of this person and the disgustingness of his criminal acts.
Another leader, obsessed with power and ready to do anything to get it, did the worst thing - he destroyed his state in order to retain his power. Contrary to the will of the people to preserve their state, he committed a crime by signing documents that did not comply with the law on the collapse of the state, which entailed the loss of territories, impoverishment of society and immersion in the chaos of civil war.
The infamous cry in the American Congress "God bless America!" showed a desire and readiness to betray the interests of his people and was perceived by the United States as a call for more active actions to destroy the Russian World.
The United States, taking advantage of the moment of weakening of its geopolitical enemy, begins processes to destabilize the economic and political situation in the entire space previously controlled by the Russians, in order to devalue all their assets and buy them at the price of green paper.
This action plan required the emission of dollars on a cosmic scale, and by 1990 the US national debt had already exceeded three trillion and amounted to 3'206'290'000'000 US dollars.
So that the printed matter does not crawl out sideways, and in order not to choke on a bold chunk, the United States decided to prepare well before the large-scale emission of dollars and work out all the processes to increase the public debt in the process of increasing the money supply within the country, setting aside 10 years for this.
The growth rate of the money supply in a steadily developing economy must strictly correspond to the growth rate of the commodity supply. Until 1991, the United States strictly adhered to this principle in regulating its economy.
In 1991, the United States began to work out the processes of increasing debt, stopping the increase in the money supply for 3 years with a growing GDP.
In 1991, 1992, 1993 and 1994 the broad money supply remained unchanged at $ 4.3 trillion. In 1995, the United States began to build up the money supply at a rate that outstripped the rate of GDP growth.
In the absence of negative effects on the US economy, the actions successfully worked out from 1991 to 1999 to increase the money supply at a rate that outstripped the rate of economic growth, began to be applied in relation to an increase in government debt at rates exceeding all reasonable limits.
In strict accordance with the well-established procedures, the United States in 1999 suspended the increase in public debt for two years (apparently in a hurry, since when the money supply was growing, the period of stoppage was three years), in order to then begin to increase it with renewed vigor.
In 2002, the planned explosive growth of the US government debt began. There were plenty of green bills to buy up the assets of their geopolitical enemy, but they only managed to bite off the fat piece and, in order not to be left without teeth, quickly dump them without a lot of salt.
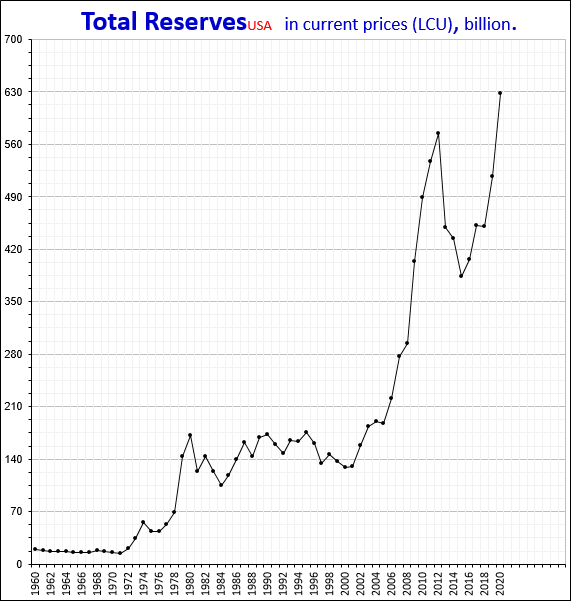
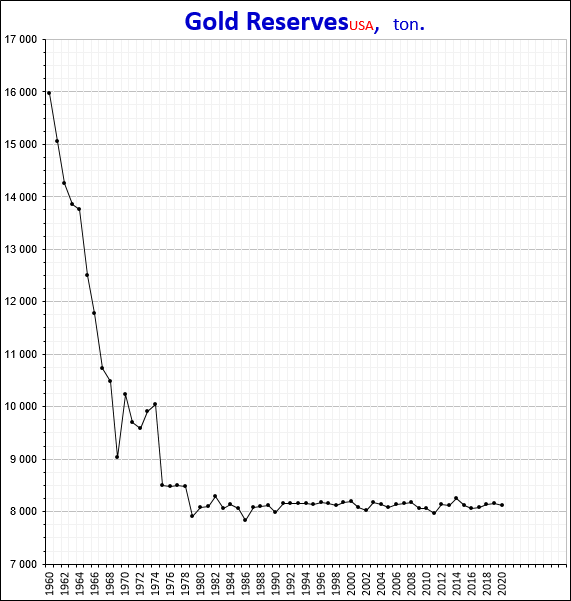
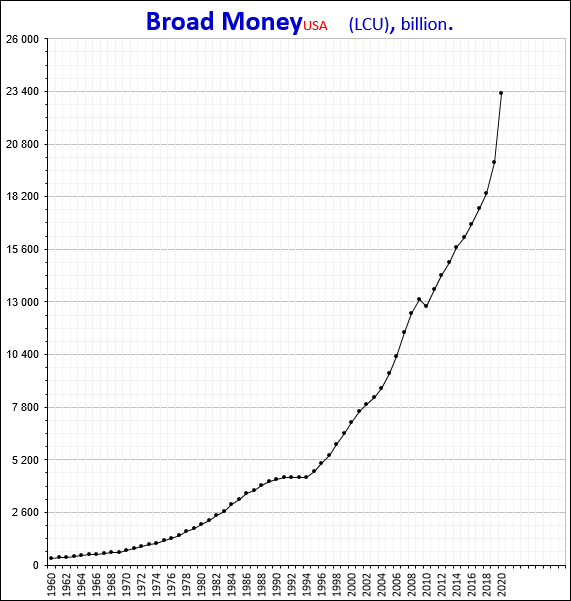
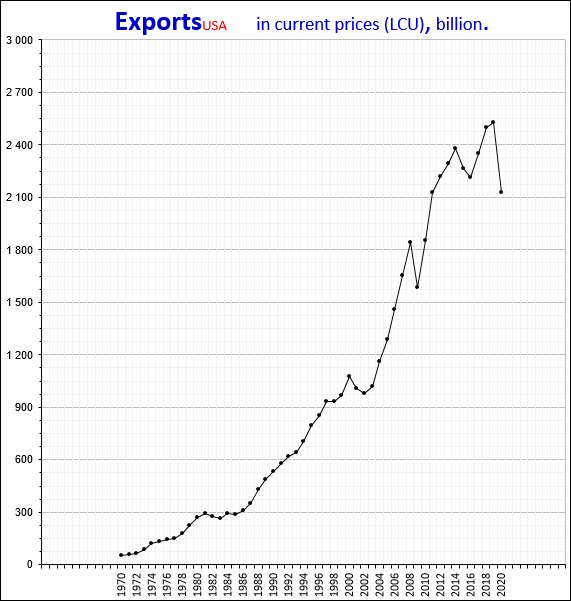
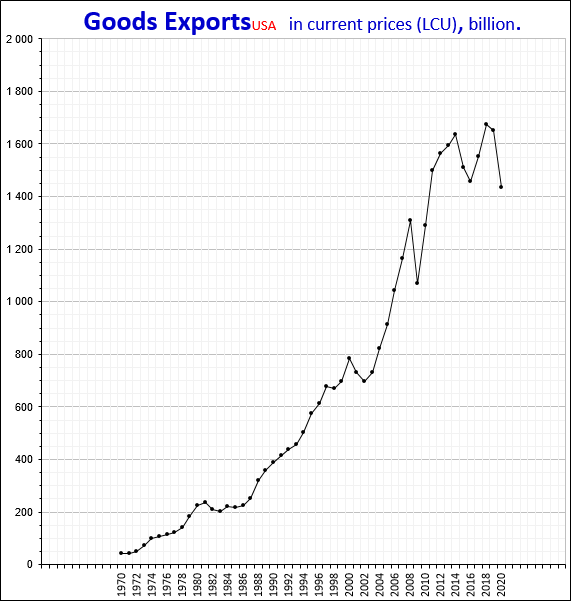
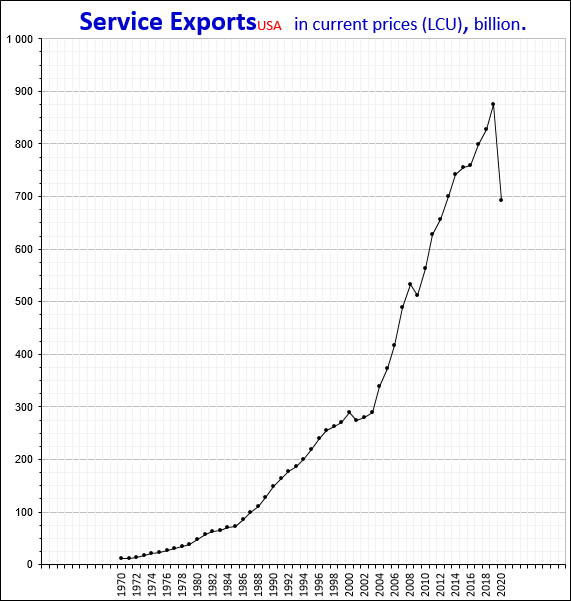

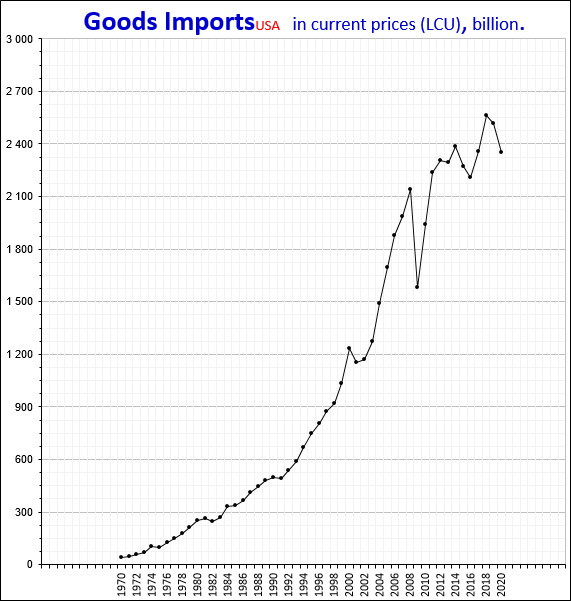

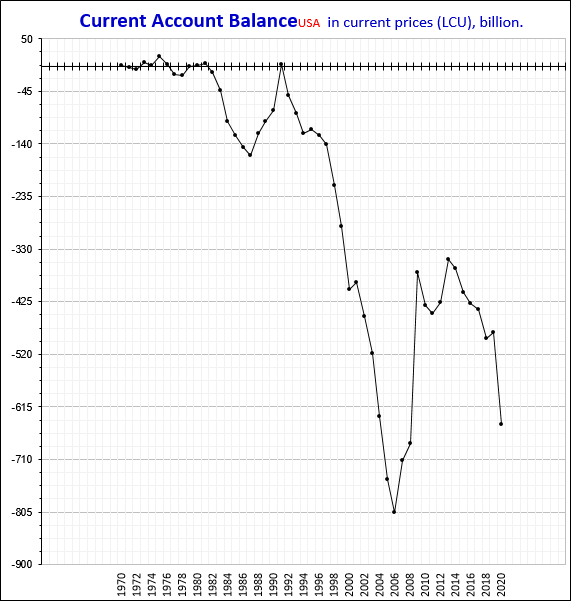
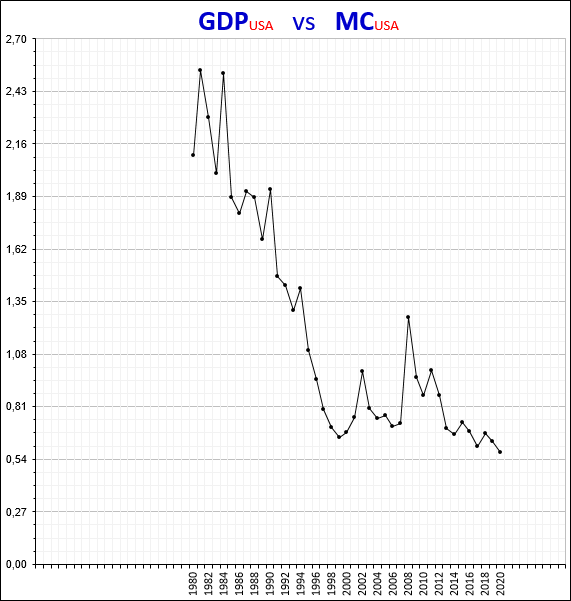
The main reason for the decrease in the indicator with an increase in GDP is the speculative growth of the capitalization of companies.
American stocks are overvalued.
Analysis of the fractal structure of the nonlinear dynamic additive-synergetic system “GDP vs MC” shows that in the time interval from 1980 to 2020, the fractal structure is formed by fractals of different orders, the segments of which are indicated on the graph in different colors.
The fractal with pink segments is the first segment of the higher order fractal, which is marked in blue. The pink fractal corresponds to fractal №21 (view 2, type 1) from the Niro Alphabet.
The fractal with orange segments is the third segment of the higher order fractal, which is marked in blue. The orange fractal corresponds to fractal № 33 (view 3, type 3) from the Niro Alphabet.
The fractal with blue segments is the first segment of the higher order fractal, which is marked in red. The blue fractal corresponds to fractal №21 (view 2, type 1) from the Niro Alphabet.
Taking this into account, we can say that the fractal ended in 2020, the segments of which are marked in green on the chart. The green fractal corresponds to fractal №33 (view 3, type 3) from the Niro Alphabet.
With the completion of the green fractal, the 1st segment of the fractal of a larger order, which is marked in blue, has ended.
Based on these data, we can talk about the end of the downtrend and the beginning of the uptrend.
The growth of the indicator values will occur within the framework of the formation of a new fractal directed in the opposite direction to the green fractal. This fractal is the second segment of the blue fractal.
After the completion of the second segment of the blue fractal, the formation of its third segment will begin.
As part of the formation of the third segment, the dynamics of the indicator will be downward.
Completion of the third segment of the blue fractal will complete the third segment of the larger fractal, which is marked in red.
The estimated completion point is 0.5 and falls in 2035.
In this case, the possible increase in the indicator values from 2020 to 2023 will be caused by a decrease in the market capitalization of American companies.
And over the entire interval (2020, 2023), the growth of the indicator will be ensured due to the fact that the rate of decline in the US stock market will greatly exceed the rate of decline in US GDP.
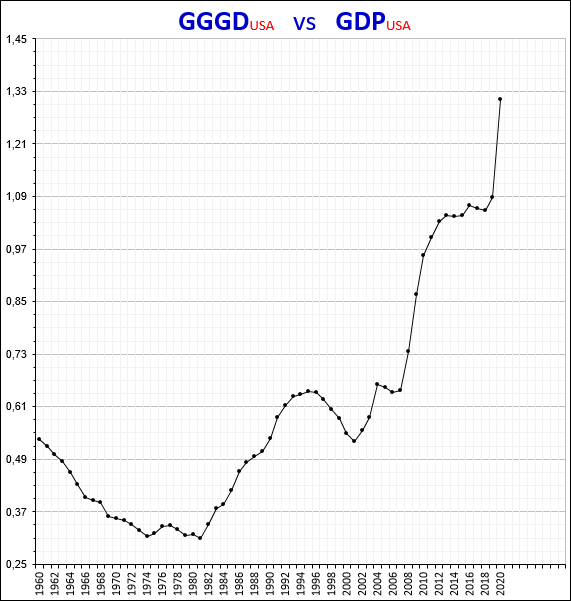
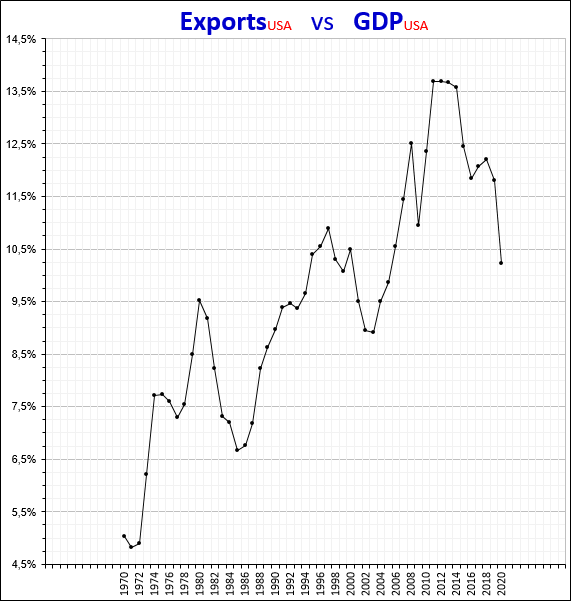
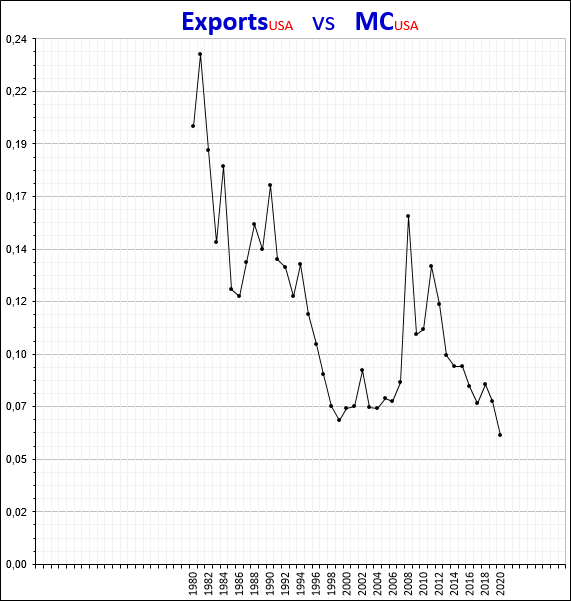

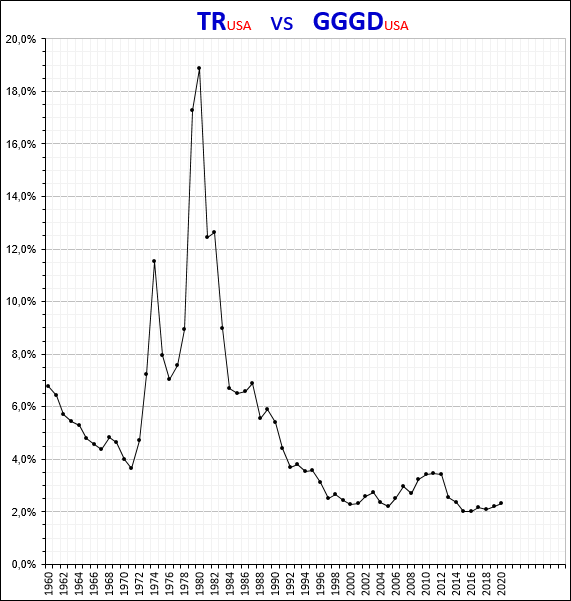
At first, the United States became a world leader thanks to its powerful economy, then they supported their leadership by providing the dollar with gold, after that they decided that it would be cheaper and more reliable to maintain leadership through military force and untied the dollar from gold.
It is one thing when creditors are much weaker than the United States in all respects, and then it is not at all scary not to pay off debts, and it is not necessary, but another thing is when creditors are stronger than you and the debt will be collected in full.
Today, the United States has greatly weakened, it has ceased to be leaders in the economy, and in politics, and in military force.
It has already become clear that the borrowed funds, the United States is not able to return, and is hardly going to. The problem of US debt will become a problem for those who have invested in it. No less problem will be faced by the owners of funds deposited in US dollars and assets denominated in them.
Against this background, the cost of gold and other precious metals will rise sharply and, moreover, will grow by orders of magnitude.
At the moment when the cost of gold becomes such that the US debt will be approximately equal to the cost of 8'000 tons of gold, the US will once again try to make a feint with its ears. They can declare that they do not owe anyone anything, that the US debt, equivalent in value to 8'000 tons of gold, must be repaid at the expense of each state in the world in an amount proportional to the share of this state in the world economy.
The United States will argue this way of writing off its debts by saying that, having shown nobility, and being guided exclusively by the interests of the world community (the entire history of the United States is replete with opposite examples), they supported the development of the world economy by pouring 8'000 tons of gold into it from their reserves. And now, the time has come for all the states of the world to chip in and return 8'000 tons of gold back to the United States. But nothing will have to be returned, since the United States is ready to netting counter claims.
Another situation is quite likely, when, in order to pay off the American public debt, a wave of nationalizations of all American assets outside the United States, including corporate ones, will sweep.
And the more the US borrows, the harder the consequences will be for them. Here everything is simple, like with a hangover, the more you drink, the worse it will be, and after a binge, health may not be restored at all.
The problem of the US public debt will be solved one way or another. To say that there will be great upheavals in the world economy is like saying nothing.
And in order for such shocks to happen as rarely as possible, the new world financial system should be created not by one state to serve personal interests, but by the entire world community on the principles of equality and respect for the interests of each state.
The beginning of the creation of a new global financial system will be the trigger for the collapse of the United States.
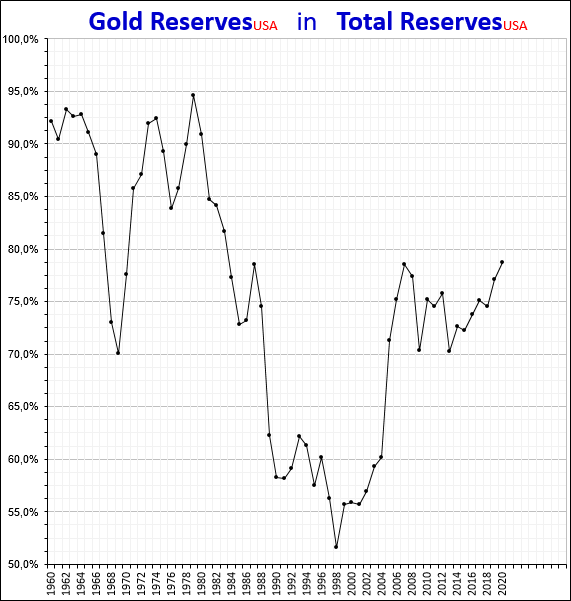

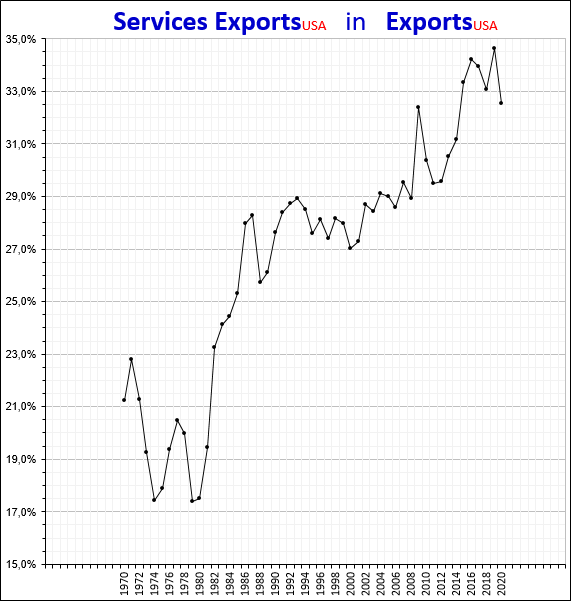
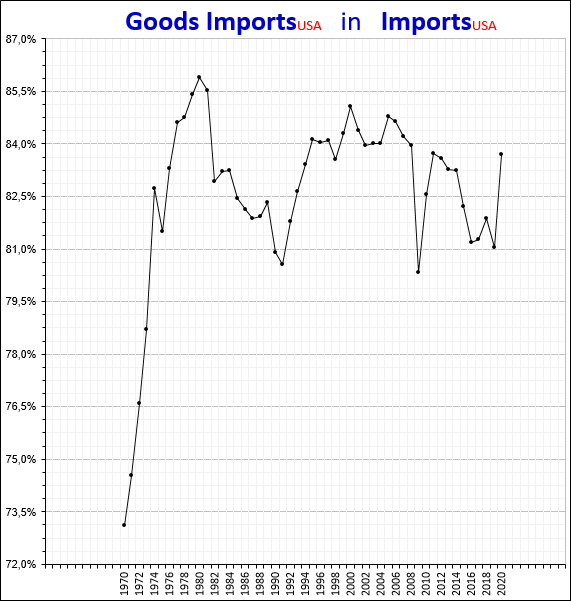
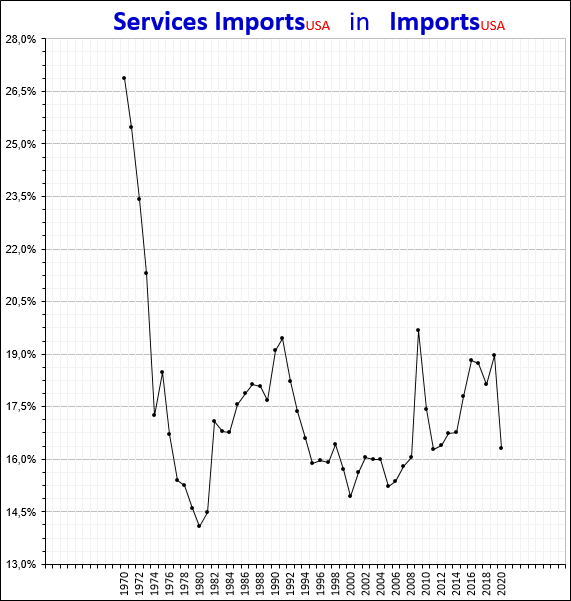
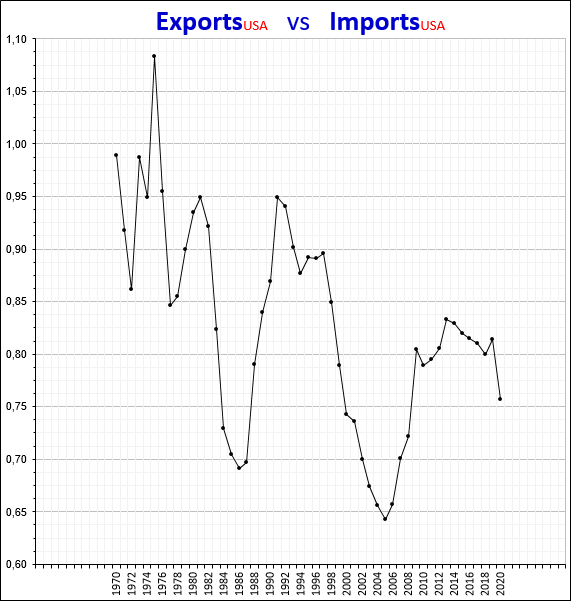
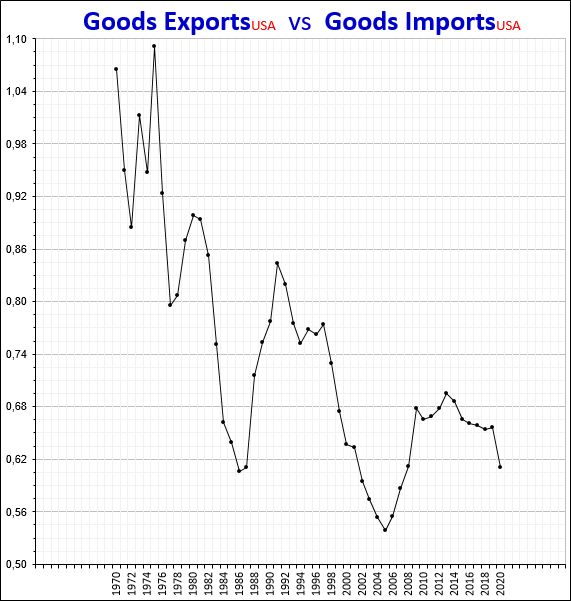
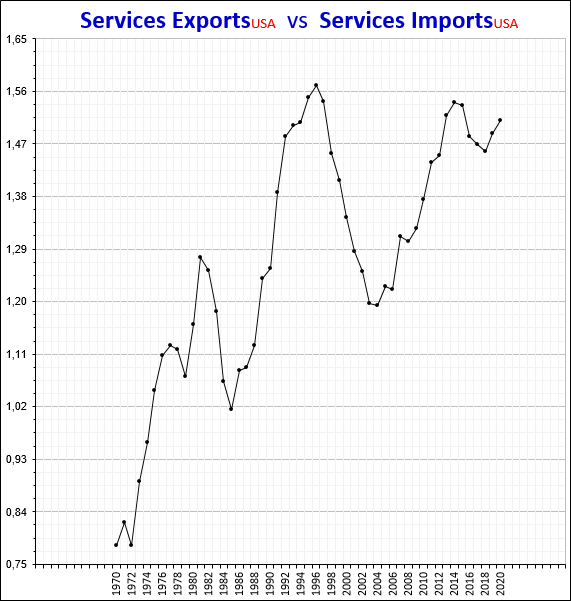
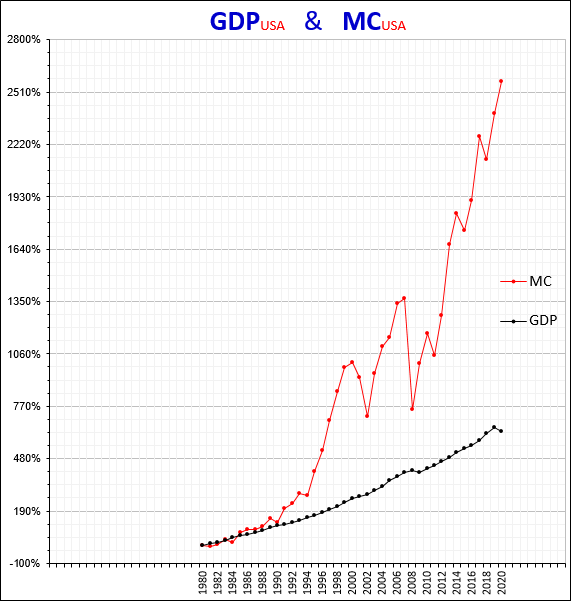
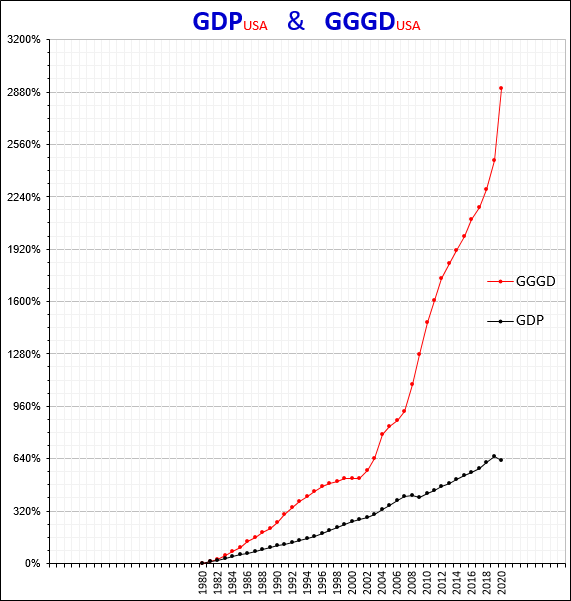
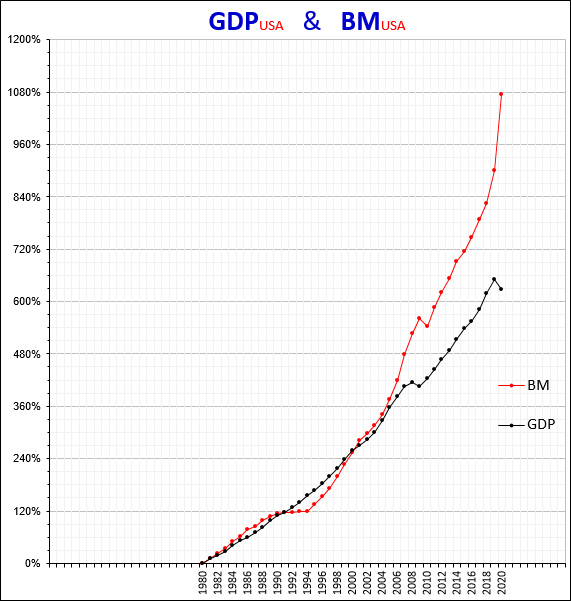
3.2.2. Analysis of the fractal structure of the US GDP graphs.
3.2.2.1. In relation to the currencies of other countries.
The graphs of the dynamics of the values of the absolute macroeconomic indicators of the United States in national currency are unsuitable for fractal analysis, since they do not reflect the fractal structure.
The real fractal structure of the values of absolute macroeconomic indicators is manifested in the graphs of these indicators, plotted according to the values that are calculated in a currency other than the national currency.
In addition to the general analysis of the dynamics of the absolute macroeconomic indicator, calculated in the national currency, in order to predict its future dynamics using fractal analysis, it is necessary to analyze the dynamics of the values of this indicator, calculated in the currencies of other countries.
The calculation of the US GDP in the currencies of other countries will allow, as it were, through the prism of exchange rates, to see the entire spectrum of hidden fractal structures of this macroeconomic indicator.
Below is the dynamics of US GDP in the charts, which are plotted according to the values calculated in the following currencies:
1. US GDP in local currency (USD);
2. US GDP in Euro (EUR);
3. US GDP in British Pounds (GBP);
4. US GDP in Australian dollars (AUD);
5. US GDP in Swiss francs (CHF);
6. US GDP in Canadian dollars (CAD);
7. US GDP in Japanese Yen (JPY);
8. US GDP in Russian rubles (RUB);
9. US GDP in Chinese Yuan (CNY).

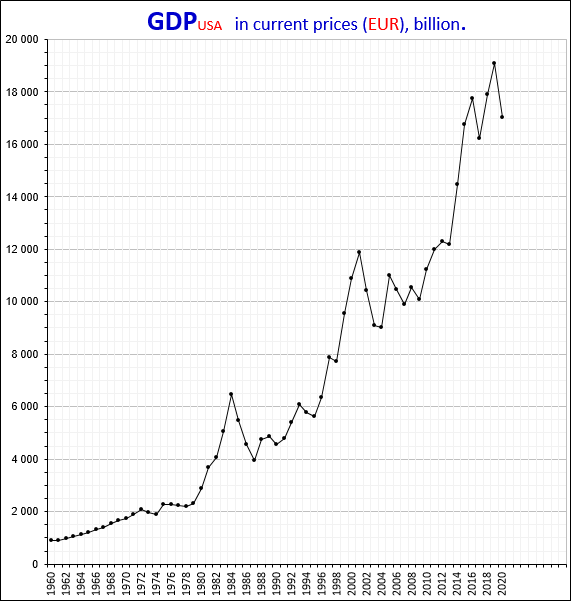
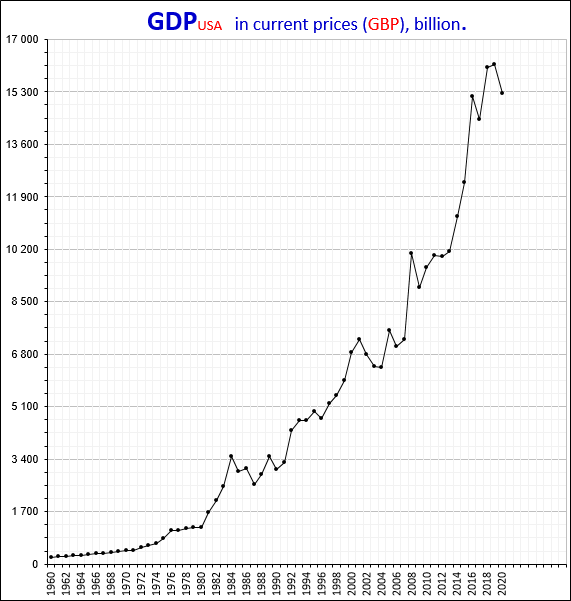
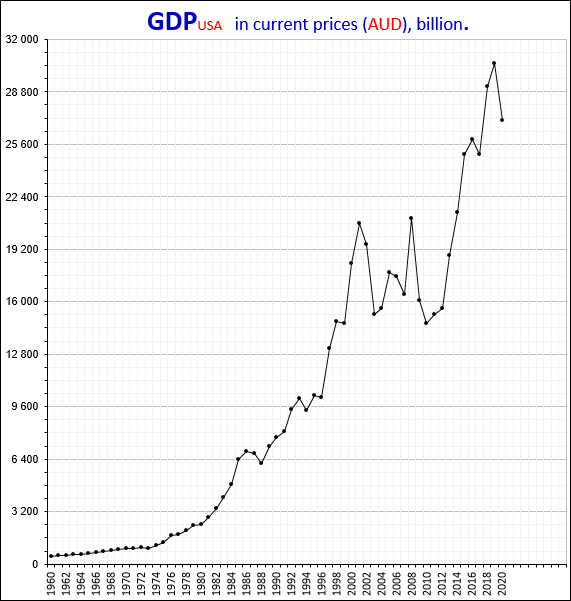
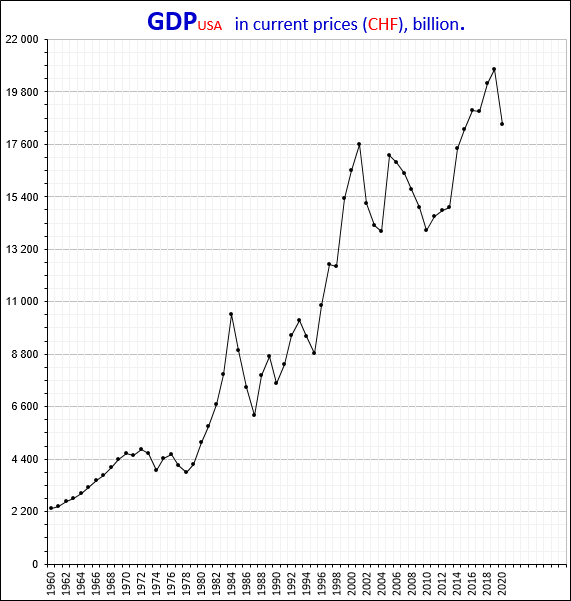
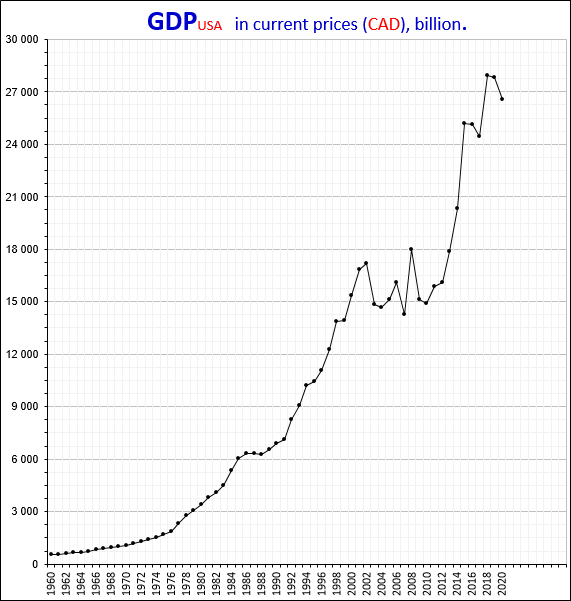
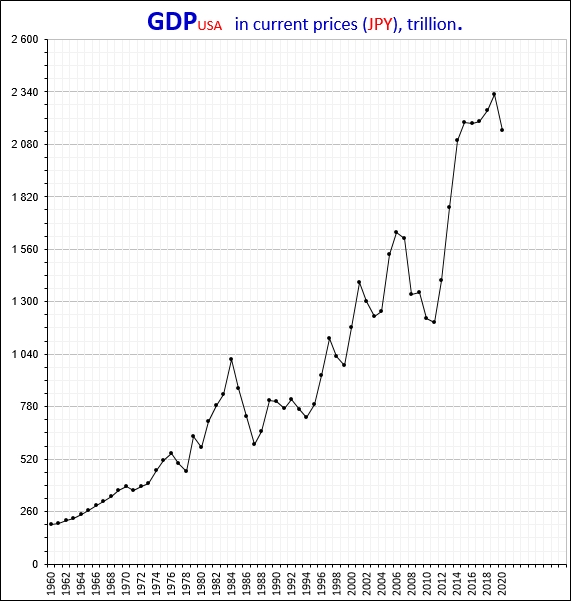
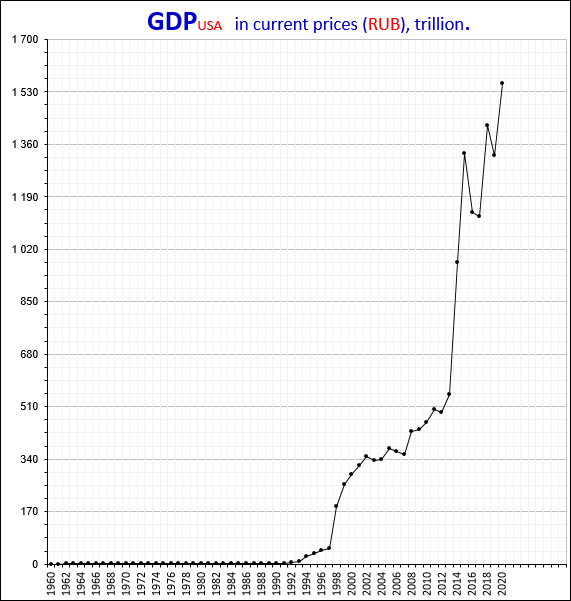
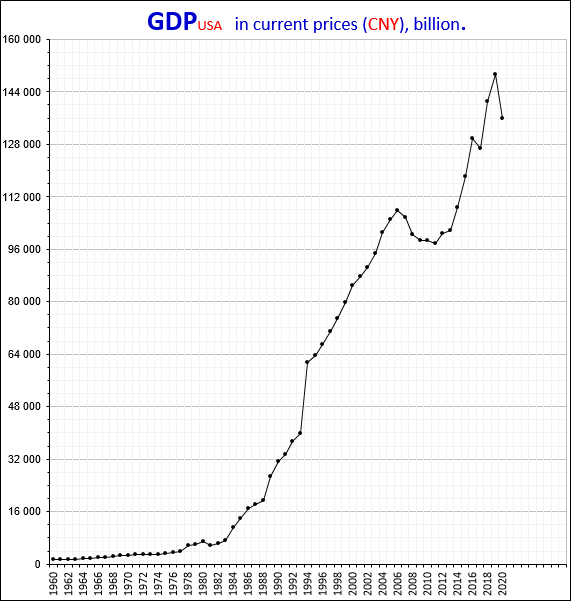
3.2.2.2. In relation to gold and oil.
The fractal structure of the GDP graph should be analyzed not only through the prism of exchange rates, but also through the prism of quotes of particularly significant financial assets, for example, through gold and oil.
Gold and oil are the basic values in the world. The dynamics of their value determines the dynamics of everything else in the world economy.
Analysis of the fractal structure of the graphs of the US GDP, measured in troy ounces of gold and barrels of oil, will determine the future dynamics of this macroeconomic indicator.
Below is the dynamics of US GDP on the charts, which are plotted according to the following values:
1. US GDP in troy ounces (XAU);
2. US GDP in barrels (Brent).
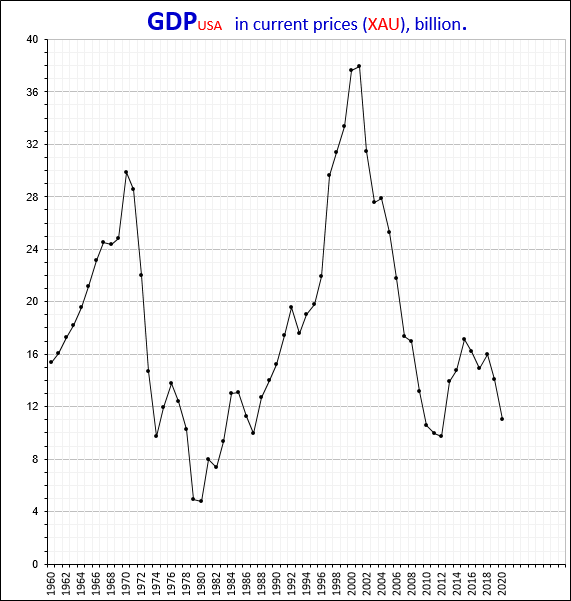
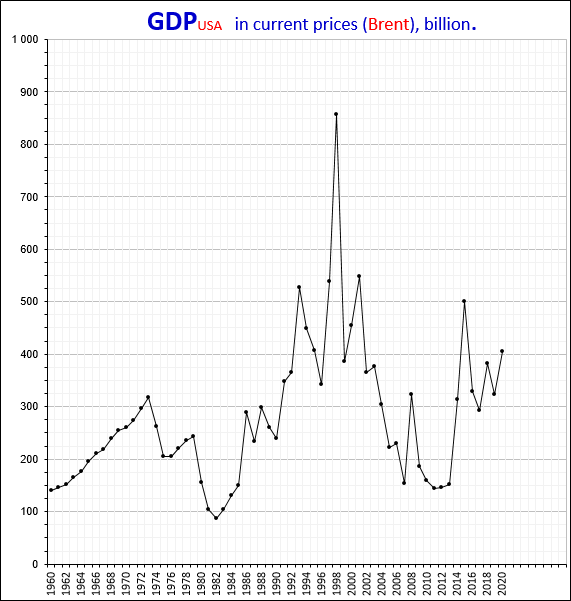
3.2.2.3. In relation to world GDP.
Conclusions regarding the future dynamics of US macroeconomic indicators should also be based on an analysis of the dynamics of these indicators in comparison with the dynamics of similar indicators in other countries.
Let us analyze the dynamics of changes in the share of US GDP in world GDP and compare this indicator with similar indicators in other countries.
Let's build graphs of the dynamics of the GDP share indicator for the following ten countries:
1. USA;
2. China;
3. Japan;
4. Germany;
5. Great Britain;
6. France;
7. Italy;
8. Canada;
9. Netherlands;
10. Sweden.
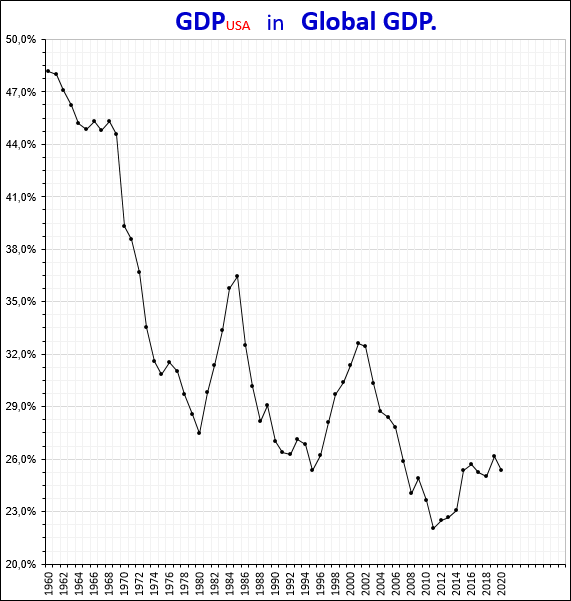
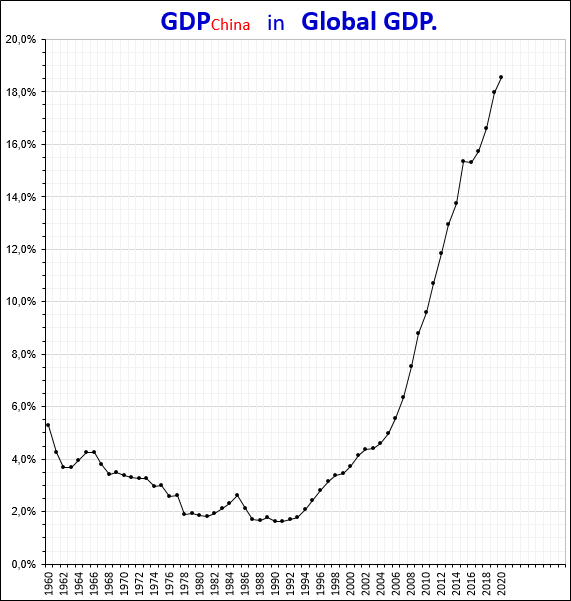
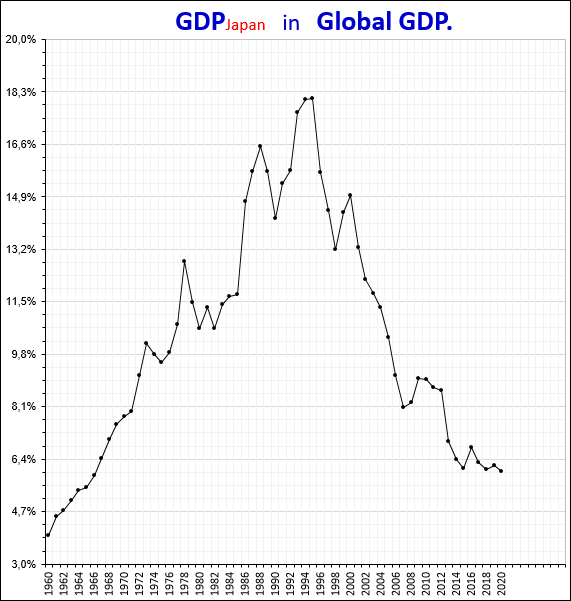
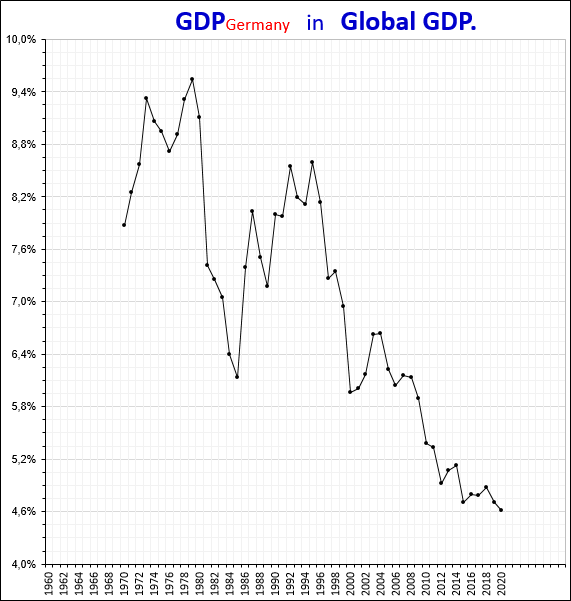
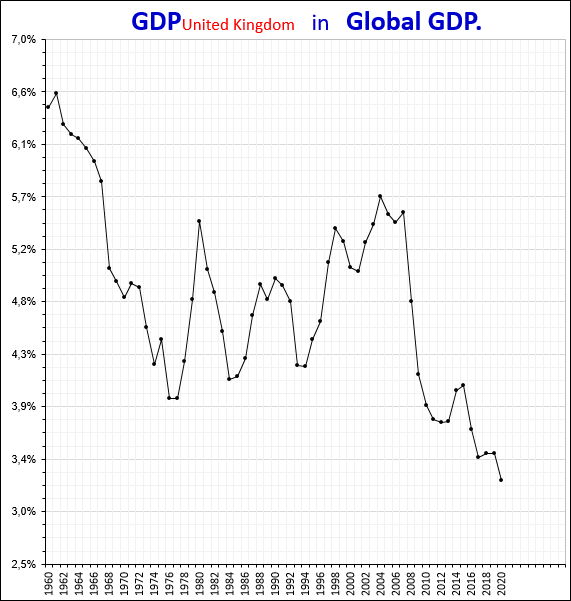

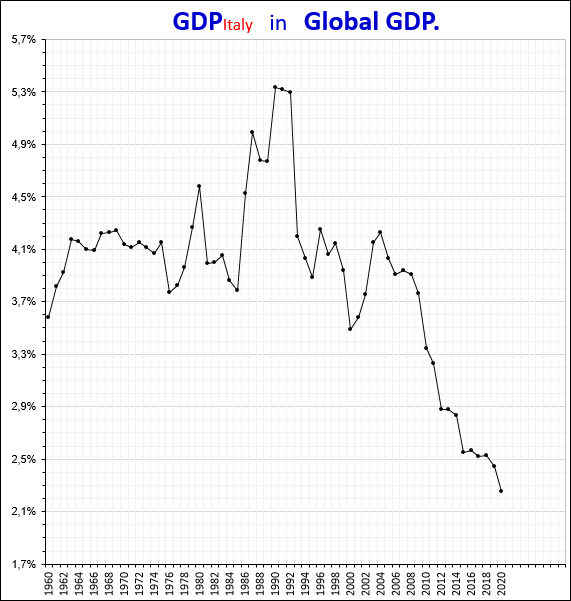
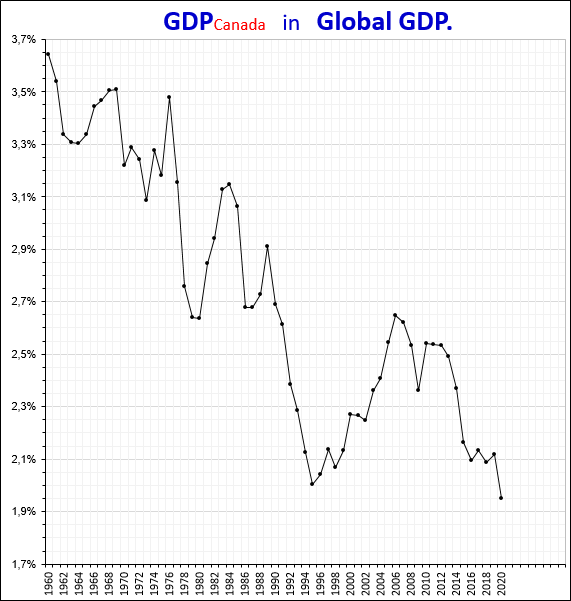
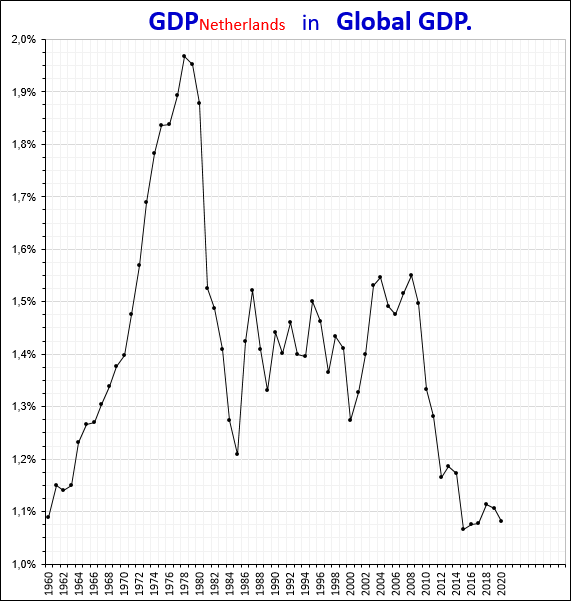
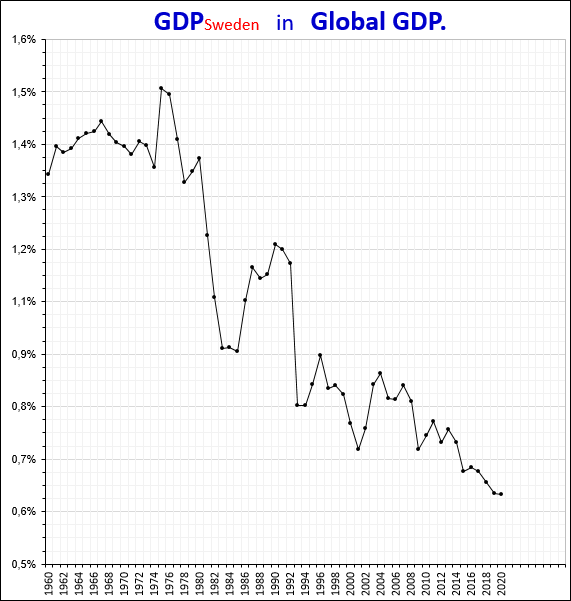
The downward dynamics of the values of the GDP of the states of the collective West in the global volume of GDP shows that the states of the collective West, led by the United States, in the competitive economic struggle are not able to be world economic leaders and are inferior to the states that they recently destroyed and plundered as their colonies.
3.2.2.3.1. Geopolitics as the basis of the economy.
Analysis of the fractal structure of the chart allows predicting its future dynamics, determining the completion of some fractals and the beginning of others.
Supplementing the fractal analysis of the graphs of the dynamics of the value of financial instruments with the analysis of macroeconomic indicators gives an understanding of what kind and type of fractals can be formed from the Niro Alphabet, that is, it gives an understanding of the amplitude of future fluctuations.
However, the analysis of macroeconomics is impossible without taking into account geopolitics, which, like the Gulf Stream, showing the directions of the currents of the world ocean, shows the directions of the future development of the world economy.
Understanding macroeconomics lies through understanding geopolitics.
Geopolitics with macroeconomics should be viewed as a function with its derivative. In other words, macroeconomics is the antiderivative of function. In this case, the understanding of the ongoing processes in the world economy lies through the differentiation of processes in world politics, and vice versa, the understanding of the decisions made by politicians lies through the integration of what is happening in the economy.
The future behavior of world politicians can be predicted with high accuracy when fractals of the highest order are completed on the charts of fractal structures of key macroeconomic indicators. A mathematical tool for calculating future steps in world politics is a method for conducting fractal analysis of nonlinear dynamic additive-synergetic systems in economics using the Alphabet of Niro Attractor for describing fractal structures.
All processes occurring in the world economy, reflected in macroeconomic indicators and visualized in the graphs of their dynamics, are a consequence of the international policy pursued by states in relation to each other.
Each state, pursuing its economic interests, pursues an international policy corresponding to these interests. Political decisions of one state in relation to other states cause one or another economic reaction corresponding to these decisions, well, or activity that directly affects the economic development of states and determines the dynamics of the world financial market.
Understanding future trends in the global financial market is impossible without understanding the foreign policy of leading world powers, therefore, the basis of economic analysis should always be geopolitical analysis.
The opinion that the foreign policy of a state is changeable and depends on its leader, political system or any other factors is erroneous. Of course, the role of the head of state in foreign policy, and in domestic policy too, is very high and the domestic political factor is important, but this does not determine the foreign policy of the state.
International relations in the world are developing in accordance with the political Gulf Stream, that is, in accordance with world geopolitics.
The consciousness of a person or a people forms his religious outlook and the territory in which he lives. Impenetrable mountains, deserts, swamps, wide rivers, straits, seas form living spaces in these territories. Absolutely everything in the world can change except for one thing - the geographical landscape formed by living spaces in the form of transport corridors and natural protection from external threats.
Peoples living in different geographic areas with different climatic conditions have different mentality. Whatever states are formed in these geographic areas, their foreign policy towards each other will never change, because the same struggle for living space will always be waged, because only the state controlling transport corridors will be able to ensure its sustainable development.
Understanding the invariability of foreign policy courses of states makes it possible to logically comprehend the predictability of their behavior in the international arena and, as a consequence, predict the future development of the world economy.
If, over a fairly long time period, from several centuries, we consider a certain geographical territory, then the states replacing on it with their borders and political systems, the changing leaders of these states, without realizing it, will always pursue the same foreign policy, which is dictated by control living space in this area.
Macroeconomic indicators are the visible tip of the iceberg of geopolitics, and in order to understand their future dynamics, it is necessary to dive deeper into geopolitics and examine its hidden underwater part.
The world, arranged as a set of political subjects, began to form in the era of the great geographical discoveries from the 15th to the 17th century, when people realized that the Earth on which they live has the shape of a ball, which means that the earth's space is finite and limited.
The states of Western Europe dragged their miserable existence on the sidelines of world history. But with the beginning of the great geographical discoveries, these states realized that new territories with colossal wealth and resources are easy prey for them.
The beginning of the fierce struggle of Western European states for the colonization of the world launched geopolitical processes that continue to this day.
Colonies have acquired: Spain, Portugal, Sweden, Netherlands, Denmark, France, Germany, Italy, Belgium, Great Britain. The British succeeded most of all the Europeans in the colonization of territories and the enslavement of peoples, it was Great Britain that began to possess the largest colonized territories. Due to the plundering and destruction of other peoples, the countries of Western Europe moved from the margins of history to its center.
After the seizure of colossal wealth, the Anglo-Saxon world, represented by Great Britain, was faced with the question of protecting the loot and retaining the power achieved by plundering and destroying other peoples in the world.
It is in Great Britain, where all minds were preoccupied with the issues of maintaining their world domination, that the concept of geopolitics as a foreign policy is born, aimed at curbing the development of states in Eurasia.
The founder of geopolitics was the Englishman Halford Mackinder. As an Englishman, he divided the entire world civilization, in English, into two civilizations - the British Empire and the rest of the world, and more specifically, into the civilization of the Sea - Thalassocracy (Greek θάλασσα "sea" and κράτος "power") and civilization Sushi - Tellurocracy (Latin tellūris "land, country" and Greek κράτος "power", "land power").
Great Britain, as a maritime power, surrounded on all sides by water, Mackinder placed at the center of the civilization of the Sea. The vast and resource-rich colonial territories of Great Britain, which needed to be constantly controlled, were located in Eurasia, so Mackinder attributed all of Eurasia to the Sushi civilization. The threat of losing control over the colonial territories, and hence the threat of losing world domination and power of Great Britain, came, according to Mackinder, from the north of the mainland, i.e. from the Russian State.
Mackinder outlined the Thalassocracy Zone and the Tellurocracy Zone on the world map with two crescents, where he marked the Sea civilization zone with the Big Crescent, and the Land civilization zone with the Small Crescent.
Mackinder considered the British Empire to be the core of the Sea civilization. And the core of the Land civilization is the territory in the center of the Eurasian continent, which is its heart, which Mackinder called Heartland and which, in his opinion, represents the Geographical Axis of History. The territory of Heartland is the territory of the Russian State.
According to Mackinder, these two centers of civilizations will form political spaces and alliances around them, striving to unite their civilizations around them. The British Empire will set the foreign policy vector for the Sea civilization, and Heartland for the Land civilization.
To the west and southeast of Heartland, Mackinder identifies two important geographic territories located at the edges of the arc of the Lesser Crescent, which gravitate towards the Land civilization, but are capable of reorienting to the Sea civilization. These two politically important spaces are Germany and China.
According to Mackinder, the political map of the world looks like the World Island in the form of a huge continent Eurasia, in the center of which, in the Heartland zone, is the Geographical Axis of History, i.e. the core of the Sushi civilization. The World Island is surrounded by a Ring of Exterior Continents and Islands. The World Island is conventionally outlined by two crescents - the Outer Crescent, which denotes the coverage of British world domination, and the Inner Crescent.
Small Crescent, also known as Inner Crescent, which includes the entire coastline of the Eurasian continent, together with the coastal zone, Mackinder called Rimland, that is, the outskirts of the continent, which is its contour. From a geopolitical point of view, the territory of Rimland is the most important territory, because it is in this territory that the civilization of the Sea and the civilization of Land will always collide in the struggle for dominance over the World.
The Land civilization, of which Heartland is the center, with the aim of its development, will always strive to control the territory of Rimland in order to provide direct access to the southern seas directly. To achieve this goal, it is necessary to have a land alliance with the territories located on the edges of the coastline of the Eurasian continent. Such an alliance ensures the unity of the territories of the World Island under the auspices of the Tellurocracy.
But the civilization of the Sea also claims to control the territory of Rimland, in view of the fact that the British Empire has extensive colonial possessions in Eurasia. Thalassocracy, in this case, will strive to spread its influence over the territory of Rimland along its entire length along the entire coastline of the Eurasian continent from Western Europe through the Mediterranean, the Middle East, then Central Asia to the Far East and the Pacific region, paying special attention to the territories located on the edges coastline.
From the point of view of Geopolitics, the territory of Heartland is the geographically most favorable springboard for establishing control over the entire continent of Eurasia. Domination over the World will belong to the state that owns Heartland, because this allows the island states to close access to the mainland.
And control over the territory of Rimland from the side of the island states ensures the containment of the state that owns the territory of Heartland in its borders remote from the southern seas, which allows you to create and maintain its world domination.
Thus, world domination belongs to whoever controls the territory of Rimland. It is the territory of Rimland that is the main and main arena of world politics. The fight for Rimland is at the heart of world geopolitics.
According to Mackinder, the main geopolitical struggle is the struggle for Rimland between Great Britain and the Russian World, which owns Heartland. The states on the territory of Rimland in this Great Game, acting on one side or on the other, perform intermediate roles in various alliances, alliances and blocs assigned to them by the two opposing sides.
The Great Game is the struggle of Great Britain against the Russian World for control over the most important strategic spaces of the Eurasian continent, which ensures the British Empire's preservation of its world domination and the continuation of the plundering of its colonies and the enslavement of peoples. The Russians, in order to develop their state, always strive to establish trade and transport corridors giving access to the southern seas.
Great Britain saw in the strong Russian State controlling the territory of Rimland a threat to its existence as a great colonial power and did everything to weaken and destroy the Russian State. The entire foreign policy of Great Britain was, is and will always be only anti-Russian, regardless of the state system, or the head of state, or anything else.
The founder of geopolitics, Mackinder, viewed the confrontation between the Russians and the Anglo-Saxons without dualism, as a confrontation between two different civilizations with different strategic goals based on civilizational and cultural principles that are alternative to each other.
However, the followers of Mackinder began to view the confrontation between the Russians and the Anglo-Saxons in the context of dualism as a confrontation between civilizations opposite to each other in culture, history, political order and other characteristics.
All the signs considered by the Anglo-Saxons in the context of dualism do not reflect the entirety of the confrontation between them and the Russians. The Anglo-Saxons have no idea where the real fault line is between them and the Russians.
History has shown that Mackinder's theory of Geopolitics works well. If we look at history, for example, over the past 100 years, we will see what great efforts Great Britain made towards the collapse of the Russian State in 1917 and its decisive role in pushing Germany to war with the Russians in 1941.
Great Britain, together with the United States, became allies of the Russians in the war with Germany solely on the basis of, so to speak, for their own safety net. When the war in Europe was just beginning, the Russians offered the British to stop Germany, but they refused, because they wanted a war between the Germans and the Russians, which was supposed to weaken both of them, leaving Great Britain, without doing anything, the opportunity to maintain its power in the world. But when the victory of the Russians over the Germans became obvious, the British, fearing that the Russians would not stop in Berlin and reach the Atlantic, together with the United States began more active actions against Germany, thereby indicating their geopolitical interests to the Russians.
The Germans who started the war with the Russians were Russians and were defeated. The Russian victory over Germany earned Great Britain the status of a victorious power. But the results of this victory for Great Britain were appalling and disastrous. Great Britain lost all its colonies and was on the verge of bankruptcy, which was avoided only by a loan of $ 3.5 billion from the United States.
The British, who once considered themselves to be the arbiters of the destinies of other peoples, found themselves in a position that can be compared with the position of a goner locked up in an outhouse.
The British Empire, which possessed the largest number of colonized territories on five continents, with a total area of approximately 32 million square meters. km, making up about 22% of the earth's land, with a population of about half a billion people living in these territories, ceased to exist as an empire, emerging from the Second World War with a bare bottom. It is absolutely clear that there was no scent of any victory in the Second World War for Great Britain here.
The Anglo-Saxons, who had lost the British Empire, changed their registration, changing one island to another, bigger and farther away, moving to America. In the civilization of the Sea, instead of the British Empire, the United States became the core, which immediately after the end of the Second World War, in the person of the Anglo-Saxons moved by revenge, began to develop a plan of attack on the Russian State, which in 1949 was ready and awaiting an order for execution. The USA planned the destruction of 100 million Russian people by atomic bombing of 100 Russian cities with atomic bombs of 50 kilotons each.
If the Russians had not created their own nuclear weapons in the same 1949, they as a people would have ceased to exist. The United States, having tested its atomic bombs on humans, dropping them on the peaceful Japanese cities of Hiroshima and Nagasaki, would have dropped atomic bombs on Russian cities without any doubt or hesitation. The only thing that stopped the United States from atomic bombing was the fear of a retaliatory strike by the Russians by nuclear bombing of American cities.
The USA, which after the Second World War became the most powerful state of the world in economic and military terms for the Russians, became a much greater threat than Great Britain was, which was trying more and more to act out of peace and the hands of other states.
The post-war years showed how correctly and accurately Mackinder described the logic of world political history. The United States proclaimed itself a world hegemon, clearly realizing that it will not become such as long as the Russian State exists, which is the only force in the world capable of resisting them. The United States, clearly realizing that they could not see Heartland as their own ears, to conquer dominance over the whole World, entered the battle for Rimland, which involved strengthening control over the Outer Crescent while strengthening positions in the Inner Crescent and blocking the Russians' exit to the southern seas by preventing alliances and Russian alliances with Germany and China (representing territories along the edges of the Inner Crescent) and the creation of hotbeds of tension in the center of the Inner Crescent in the southern underbelly of the Russian State between the Black and Caspian Seas.
A military attack by the Americans on the Russians threatened a nuclear war in which the United States could not become the winners, and in general could disappear from the world map as a state. Therefore, the United States decides, instead of direct military confrontation with the Russians, to conduct mental wars against the Russians, to unleash military conflicts along the borders of the Russian State, while simultaneously creating biological weapons in laboratories along the borders based on biomaterials taken from the Russians for use against the Slavic population.
For the Great Russian State to become a Mighty Power, peace is necessary on the entire Eurasian continent. All peoples inhabiting Eurasia are in the same boat, the rocking of which is not in their interests. Economic development is impossible when there is war and human blood is shed. The Russian people is a peacemaker people who have always strived and will strive for a peaceful settlement of any conflicts arising in Eurasia. The Russian people can flourish and develop only in the world and only on an equal basis together with other peoples, and not at the expense of other peoples.
For the United States, the situation is the opposite. The United States is located on another continent, on which it is isolated, the United States will always remain on the periphery of world development. To become a great state dominating all the states of the World, the United States needs to arrange conflicts on the Eurasian continent, generate hatred, unleash wars, sow fear and chaos, exterminate peoples, in general, do everything so that other peoples do not develop, but conflict and kill each other. friend. While some peoples of Eurasia, weakening themselves, are at war with others, killing each other, the United States earns from the sale of weapons, food and everything else that is not able to produce war-torn economies. The prosperity and power of the United States can be built exclusively and only on wars and conflicts at the expense of the impoverishment and grief of other peoples living outside the American continent.
The Russian people stand guard over the world and are committed to the development and prosperity of all peoples on Earth. And there is no need to doubt that the peace-loving Russians, like Orthodox Christians, will use all their strength to forestall absolute evil in relation to other peoples.
Returning to the dualism in geopolitics, it can be argued that the fault line between the Russian World and the countries of the collective West, headed by the United States, runs not along the geographic, not on the worldview, not on the value, not on any other sign or signs. The confrontation between the Russian State and the United States is not a confrontation between two civilizations, but much deeper, it is a confrontation between:
Good and Evil;
Love and hate;
Truth and lies;
Eternal life and eternal death;
God and the devil.
Everything that happens in the world is a confrontation between Christ and the Antichrist.
In this confrontation there is no gray, in this confrontation everything is obvious, like white and black, everything is extremely contrasting, clearly and clearly who is on which side.
Mackinder, unfortunately, did not understand this. The West does not understand this even now. Apparently, they do not want to understand.
Question from the Munich speech "Do you even understand what you have done?" still continues to hang in the air.
The split of the single Christian Church into Orthodoxy and Catholicism happened due to the departure of Catholicism from the true teachings of Jesus Christ. Catholicism rejected God and replaced him with the Pope, a simple sinner declared to be infallible. Catholicism trampled on the true Christian Faith. This was well demonstrated first by the Crusades, and then by the colonization of the territories of other states by the Christian peoples of Western Europe, which were no longer essentially Christian. The peoples of Western Europe discredited the Christian doctrine of God as the God of Love, engendering hatred of Christianity among the Muslim world and peoples of other religious beliefs, which they came to plunder, kill, rape and enslave.
The peoples of the countries of Western Europe, rejecting the basic commandments of Jesus Christ “Love your neighbor as yourself”, “What you don’t want for yourself, don’t do it to another,” that is, “don’t kill,” “don’t steal,” “don’t desire anything that from your neighbor ”, rejected God himself and imagining themselves to be exceptional peoples, people of the so-called first class, took up arms and went to seize foreign territories with the aim of plundering, enslaving and destroying other peoples.
The Russian State, consisting of Russian people professing the Orthodox Christian Faith, was the complete opposite of all European states. The Russians have always fought against the invaders and only for the territories of living space, which gave the opportunity to access the seas and provided trade and transport corridors. At the same time, the conquered territories were not plundered, but developed, and the peoples living in these territories remained independent and free people and were part of the Russian State under its care and protection.
The existence of the Russian State as great and powerful is possible only in a World in which there are no wars, but there is agreement between peoples on an equal basis.
The existence of the United States as a powerful state standing in the center of the world, to which other peoples are subject, is possible only in confrontation with the Russians and only in a World full of wars, conflicts, contradictions and chaos, contributing to the constant weakening and restraint of the development of other states.
Everything positive that happens in the world outside the borders of the United States undermines the hegemony of the United States, and everything negative strengthens the world domination of the United States.
Everything related to the success of Russians in the World in any area of life, be it science, medicine, sports or whatever, will always be perceived negatively by the United States. And vice versa, everything that will be associated with the weakening of the Russians, the United States will always be perceived positively and in every possible way supported and encouraged by them.
The foreign policy of the United States and all its actions are aimed at curbing the development of other peoples and, first of all, at containing the Russians and the destruction of the Russian State from within by the hands of the Russians themselves.
The United States, which turned out to be the strongest economy in the world after World War II, was unable to maintain dominance in the world due to it, because the rapidly developing economies of war-torn states began to outstrip the United States in the competitive struggle.
The United States saw its retention of dominance in the World only at the expense of military force. The armed forces are called upon to protect the inviolability of the borders of their state. The United States, on both sides, surrounded by oceans, has land borders with only two states - Canada and Mexico, which the United States cannot threaten in any way. Therefore, the most powerful army in the world, which the United States created, had for its purpose not a defensive function, but an offensive and punitive one.
The US armed forces, present around the world at US military bases, are a tool of pressure, threats, blackmail and intimidation. The military campaigns conducted by the United States around the world are aimed at destroying states, with the aim of organizing chaos in the lives of people in these territories and destabilizing the peaceful situation, to destroy economic growth and impoverishment of peoples.
The US Armed Forces are the club they use to bludgeon weak states that are unable to respond. In the event of military aggression against the United States, their armed forces will be unable to defend their state, because they have always carried out punitive operations that have nothing to do with the defense of their state. US military doctrine is offensive, not defensive.
The United States will never enter into an open military conflict with the Russians, therefore, in the fight against the Russians, the United States assigns the other peoples the role of cannon fodder. All peoples, including Europeans, who think of the United States as a loyal ally and reliable partner, the United States will be the first to be thrown into the meat grinder of a war of destruction. The United States strives to ensure that there will never be strong states in Eurasia. States gaining strength will be torpedoed in every possible way by conflicts and wars organized by the United States.
In the struggle for its world domination, the United States, under far-fetched pretexts, unleashes wars, manipulates facts to stir up conflicts, incite some peoples against others, corrupt local authorities and put states under external control, by blackmail and threats incline states to pursue pro-American policies, organize coups d'état without fear to be justly punished commit crimes against humanity, destroy states and their leaders by military force, plunder resources and destroy peoples, encourage the production of drugs and their trade on the territories of other states, promote all kinds of sexual perversion, in general, engage in any abomination, personifying absolute evil.
Russians, on the contrary, resist evil, stand up for truth and justice, fight for living space for the benefit of all the peoples of the world. The defeat that the Russians will inflict on the Americans will plunge the United States into a state similar to that in which Great Britain was not so long ago after the Second World War.
The desperate struggle of the United States for world domination is well traced in the events and political processes taking place in the states located on the territory of Rimland.
3.2.2.3.2. USA against the World in the fight for Rimland.
The containment of the Russians implies on the part of the United States, first of all, the seizure of control over the territories of Rimland along the edges of the Inner Crescent and in its middle.
US control of the Rimland territories along the edges of the Inner Crescent allows Russians to prevent the Russians from entering into key alliances with the states of these regions to reach the southern seas.
US control of the Rimland territories in the center of the Inner Crescent creates a zone of instability out of war-torn territories, deprived of the opportunity to develop and thereby hindering the advance of the Russians to the southern seas.
Control of the Rimland territories on the upper edge of the Inner Crescent allows the containment of the Russians in Europe.
Control of the Rimland territories in the middle of the Inner Crescent allows for the containment of the Russians in the Middle East and Central Asia.
Control of the Rimland territories on the lower edge of the Inner Crescent allows for the containment of the Russians in Southeast Asia.
Deterring the Russians along these lines will allow the United States to create a buffer zone for further attacks on Heartland.
The United States, in its unrestrained and manic desire to dominate the World, will follow the path of containing and destroying the Russians without regard to who is the leader of the Russian State and what political system is in the Russian State.
All US aspirations will always be aimed at liberating Heartland from the Russians, so next to the buffer zone will be the zone along the current border of Kazakhstan and Mongolia.
You don't need to be seven inches in the forehead to understand that with such a buffer zone there will be no Russians.
Having seized the Heartland, the United States will destroy both Germany and China, and in general all states that now exist within their borders, in Eurasia.
The dream of the United States to take possession of the Heartland of the Earth and dominate the entire planet Earth is a pipe dream, because the Russian Spirit cannot be destroyed and the Heartland is inseparable from the Russian Spirit.
In 1945, the land border of the Russian State, which won first in the Great Patriotic War, and then in the Second World War over the aggressors in the person of Germany and Japan, who set themselves the goal of the complete destruction of the Russians, in the middle of the Inner Crescent came close to the borders of Rimland, and in the upper part of the Inner Crescent it was covered by.
Following the results of the Second World War, the Russians secured control over the straits between the North and Baltic Seas with access to the Atlantic Ocean, concluding on May 14, 1955, the Treaty of Friendship, Cooperation and Mutual Assistance with the following socialist countries: GDR, Poland, Romania, Hungary, Bulgaria, Czechoslovakia, Albania. Socialist Yugoslavia gave the Russians the opportunity to access the Mediterranean Sea through the Adriatic and Ionian Seas.
The Warsaw Pact was concluded in response to the creation of the NATO bloc on April 4, 1949.
Following the Second World War, control of the Rimland territory at the top of the Inner Crescent was held by the Russians.
Germany, as a key territory of the upper part of Rimland, as a result of defeat in the Second World War, was divided between the Russians, Americans, British, French, that is, between the Russians and the United States represented by the NATO bloc.
The peoples of Africa, the Middle East, Asia, oppressed by the peoples of Western Europe who colonized them and who were in a state of slaves, received, thanks to the Russians, freedom and independence, created states friendly to the Russians.
Organized by the peoples of Western Europe, who considered themselves people of the highest class, slavery was eliminated by the Russians.
The Russians did not conquer anyone. The Russians won in the Second World War an absolute evil in the person of the German people and other peoples of Western Europe, who robbed and destroyed other peoples and who decided to physically destroy the Russians and take away the land on which they lived.
Having liberated the enslaved peoples, the Russians received states that were friendly to themselves. The Russians, fighting for their survival, won a monstrous war at the cost of 27 million lives of their compatriots, and without striving for any control over the territory of Rimland, they gained this control and became a powerful state of the World.
The Russians were allied with Germany and China, located on the edges of the Inner Crescent, had excellent relations with India and influence over Iraq and Syria, located in the middle of the Inner Crescent. The key countries located on the territory of Rimland were supportive of the Russians.
The United States, with its powerful economy, did not have any serious influence in the territories of Rimland, in comparison with the Russian State. Driven by the goal of world domination, the United States set itself the task of first taking control of Rimland from the Russians, and then of their territories.
Russians, on the other hand, export security in its broadest sense, ranging from the security of a person's spiritual development, ending with his security of physical existence, which includes defense, education, medicine, food and energy security, in general, everything without which the state cannot develop. Therefore, the settlement of conflicts in North America will not do without the participation of the Russians.
According to the United States, Russophobia, as a very highly paid product of the United States, should stop and terminate the provision of security by the Russians for all peoples of the World.
Russophobia is not about the fear of Russians, it is about the fear and unpleasant sensations of seeing in the mirror all the disgusting abomination of one's dirty life in sin as in shit. Those living in mud and surrounding themselves with mud, who have lost their human face and all hope of getting out of this mud, feel themselves next to clean people in white clothes extremely flawed and uncomfortable, fully realizing that they are covered from head to toe with their own feces.
Russophobes, instead of making incredibly huge efforts to wash off the shit, bringing themselves into a form befitting a normal person, on the contrary, make efforts to destroy everyone who does not want and does not live in shit with them.
The Russophobia incited in the World by the countries of the collective West, led by the United States, with the aim of destroying Orthodoxy, is precisely aimed at making the whole World, together with the United States, plunged headlong and live in shit.
However, as more than two thousand years of history testifies to us, the destruction of people professing Orthodoxy does not destroy Orthodoxy itself, but on the contrary, it revives and elevates, because the knowledge of God and the acquisition of the True Orthodox Christian Faith in a person does not lie through wealth and a full stomach, but through need, pain, deprivation, humiliation, trials and suffering.
The teachings of Jesus Christ, in addition to faith in God, gives an understanding of the events and processes taking place in our world in world politics and, as a consequence, in the world economy.
3.2.2.3.3. Orthodoxy and the Russian Spirit.
Let's return to the charts and take a closer look at the dynamics of US GDP in relation to world GDP and compare with the dynamics of this indicator for the GDP of China and other countries of the collective West.
The dynamics reflected in the graphs show the results of the struggle between the oppressors, that is, the former colonialists and slave owners represented by the countries of the collective West, led by the United States, and the former oppressed slaves.
The United States and the countries of Western Europe, selectively taken as an example, in the past colonial powers that destroyed peoples in the territories they colonized, over the past 60 years have shown a decrease in the share of their GDP in the world GDP.
The process of decreasing the share of these countries in world trade and reducing the influence of these countries in the world economy is a natural process for the return of these countries to their natural states, in which they were earlier in history before the robberies and murders of other peoples.
These countries, led by the United States, belong to the so-called countries of the collective West, which are not able to win in a fair competitive economic struggle with other countries and are extremely concerned about the processes taking place in the world economy, lowering them back from heaven to earth, that is, to the periphery of world history.
The countries of the collective West like to call themselves developed, civilized and democratic. But one must understand that if someone says something somewhere, this does not mean at all that it is so in fact. The leading countries of the collective West: the USA, Germany, France, Great Britain, Italy and Japan and Canada that have joined them, are not and have never been neither developed, nor civilized, nor democratic no matter how many times they talked about it, because with infinite by repeating the word halva, it does not become sweeter in the mouth.
These countries have no reason to call themselves civilized. The countries of the collective West became not developed, but rich, and not due to their hard work, but due to the robbery and destruction of other peoples.
The United States emerged as a state with a slave system of European immigrants due to their robbery and genocide of the indigenous population of America, the seizure of gold, land, resources from them and the accumulation of capital through free slave labor imported from Africa by black slaves on cotton and sugar cane plantations.
The countries of Western Europe amassed their capital by colonizing and plundering the territories of other states, exterminating the local population that rebelled against them. There would be no industrial revolution in Great Britain without capital made on the blood of the peoples enslaved by the British.
The countries of the collective West are able to ensure their economic development only by exterminating other peoples and plundering the wealth belonging to these peoples. How can these countries be called developed and civilized in this case? Of course not!
The whole vile and vile essence of the countries of Western Europe manifests itself in the man-hating ideologies that are regularly emerging from century to century in the supposedly cultural and supposedly humanistic societies of these countries. A very vivid and fresh example is well shown by the history of the beginning of the Second World War, when a developed, civilized German society, inspired and reveling in progressive European philosophical thoughts, measured the roundness of its skulls with a compass and came to the opinion that it was an exceptional nation called to rule the whole World. Armed with a misanthropic ideology, Germany showed the whole world all its devilish essence. In dire need of cheap resources for the development of their economy, the German people decided to take these resources by force from those who possessed them, and to kill everyone who stood in their way.
The German people declared themselves supermen, and the Slavic peoples were subhumans, having no right to exist and subject to destruction, and, supported by other European peoples, together with them, went to rob, kill, rape, and enslave the peoples belonging to the Russian World.
In the genocide of the Russians, along with the German executioners, executioners from Romania, Finland, Italy, Hungary, Slovakia, as well as volunteer punitive detachments consisting of the French, British, Italians, Belgians, Dutch, Finns, Danes, Norwegians took an active part as their allies , Czechs, Slovaks, Albanians, Romanians, Hungarians, Bosnians, Poles, Serbs, Bulgarians, Latvians, Estonians, Croats, Galicians, as well as traitors to the Russian World, German hangers-on and sycophants who live together with the Russians in the same state and stabbed them with a knife in back.
In general, the executioners and punishers, together with the German people, became peoples of more than 50 nationalities, including Jews (about 150'000 punishers), which is confirmed by the numerous facts of their capture (more than 10'000 punishers) by the Russians during the combat battles with the German aggressors and invaders.
The prudence and practicality of the Germans, their desire to benefit and benefit from everything, manifested itself in everything in full, and even in the brutal murders of people.
For the physical destruction of all Russians, which is confirmed by official documents of the German state, the Germans organized a separate branch of their economy, drew up a real business plan, within the framework of which they developed technological processes for cost-effective deprivation of life for people and built for this all the necessary infrastructure and a huge network of death factories with concentration camps, where men and women, adults and children were forcibly taken by the Germans on trains, then robbed and killed in gas chambers, took their blood and cut out their internal organs, cut their hair and skinned, and then burned them.
The products of these death factories in the form of the results of all kinds of medical experiments on people, experiments on testing various poisons on the human body, testing new drugs on humans before using them by German superhumans, as well as human hair, human skin and ash after burning the remains of human bodies in quality secondary raw materials were used in branches of the German economy for the production of German GDP.
The Germans had secondary raw materials not only for people, but also for all their personal belongings, which, like secondary waste, were collected and sorted into separate groups of goods, consisting of leather, metal, glass, paper, textiles, plastic, and then sent for further processing. to enterprises in Germany for the production of consumer goods, in order to meet the insanely growing demand for "civilized" German households.
Personal belongings of people made of precious metals were considered of particular value, including dentures made of gold, often knocked out by German executioners with butts and hammers directly from living people, which brought German fiends much more pleasure (confirmed by photo and video materials) than sifting the ashes left after separation of gold metal from human flesh by incineration.
All these German atrocities do not require any proof, since the branch of hell on earth, arranged by these "progressive" Germans, or rather the servants of the devil, is confirmed:
• Documents of German state authorities in the form of: orders, decrees, orders, instructions and other documents drawn up and signed by the top leadership of Germany;
• numerous films and photo materials that capture the entire horror of this technological process of brutal murders, which were made, among other things, by the German executioners and punishers themselves for eternal memory;
• documented multiple testimonies of witnesses, people brought as raw materials for the German economy to death factories for their further processing, according to German economists, into something more useful than they were, who saw with their own eyes all the work of these death factories from the inside, personally survived all this nightmare and horror and who were lucky enough not to become ashes for the production of German soap in the ovens of crematoria, designed for them by German engineers and built for them by German workers, and survive only thanks to the Russians who liberated them and stopped the work of the German death factories.
The German economy has shown staggering growth through the use of free Russian slave labor and looted raw materials. The German people, feeling their impunity, showing wild, sometimes bestial, or rather simply devilish cruelty to people who had never done anything bad to them, robbed and killed them just because they were Russians.
The Germans exported everything from the occupied and occupied territories - people as slaves, cattle, raw materials and even land (black soil) were exported.
Exported from plundered Russian warehouses, finished agricultural products and various industrial goods went directly to German cities on the shelves of German stores for “developed and civilized” German consumers.
Well, the exported priceless cultural values belonging to the Russians were immediately placed in the expositions of museums in Germany to enrich the already “too rich culture” of the German people.
This is Germany in the European sense, a model and standard of "a free, developed, civilized, progressive, democratic state built on the principles of humanism, humanity, tolerance and tolerance."
Germany, which carried out the genocide of the Russians, France, which carried out the genocide of the Africans, the Great Britain, which carried out the genocide of the Indians, Japan, which carried out the genocide of the Chinese, all countries of the collective West, led by the United States, which carried out the genocide of the indigenous population of the American continent, hands up to the elbows in human blood , which they will never be able to launder, no matter how hard they tried to do it. These countries to this day are engaged in murder and robbery, spreading evil throughout the world.
Countries cannot be called civilized and developed if on a regular basis one misanthropic ideology is replaced by another and which bring death and hatred to the World.
The countries of the collective West are not civilized countries, but robbers from the high road who rob and kill, “having put together a criminal community, called in the common people a gang” called the Big Seven, abbreviated as G7.
Things must be called by their proper names. The name “Gop-stop countries” is much more correct and correct in meaning than “G7 countries”.
The G7 group of countries should be called the group of gop-stop countries. This name suits them perfectly and describes their essence. The Russian State should never be part of this criminal group.
Taking into account the fact that these countries have united in a group, then after the investigation of all their crimes that have no statute of limitations, since they are associated with the genocide of peoples, and the trial over them, convictions should be handed down more harsh and harsh as for crimes “committed by a group of persons by prior agreement”.
Gop-stop countries call themselves developed, civilized, democratic, free, humane, tolerant and other lovely names, but all this is definitely not about them. It must be understood that all these adjectives that are caressing for their ear are a screen, decorations that perform the functions of sheep's skins, in which seasoned wolves have clothed themselves.
Well, to be more precise, in terms of their content, the United States and all its henchmen and sycophants in the face of European states are such beautiful, elegant, made of precious woods, inlaid with gold and silver, decorated with precious stones, coffins, inside which the vile stench of decayed human flesh.
The gospel given by God to people through his Apostles is the pivot on which the life of people on Earth should be based. The core of humanity is the following two commandments from the Gospel:
"Love your neighbor as yourself ..." (Mark 12:31);
“In everything you want people to do to you, so do you to them ...” (Matthew 7:12).
God tells people very clearly and understandably - love and do not harm. But as the whole history shows, the peoples from the group of gop-stop countries are not capable of this. It is precisely in this inability that the exclusivity of the peoples of the collective West lies in front of the rest of the peoples, about which they so love always and everywhere arrogantly proclaim.
And the gop-stops of the country are incapable of fulfilling the commandments given by God because they are the servants of the devil and do the devil's will - hate and kill!
But as the same history shows, only the Russian Spirit is able to put in place the brains of nations that consider themselves exceptional, doing this from time to time and as necessary, when the level of exclusivity of these exceptional nations begins to go off scale, reaching extremely critical values, and has already spread from these exceptional peoples the stench becomes simply unbearable to endure.
It is the Russian Spirit, not man, who is capable of stopping the iniquities of the collective West, led by the United States. Because a person is a weak flesh, which consists of a head, a torso, two arms and two legs, demonstrating efficiency while staying in a narrow range of ambient temperatures and a much narrower internal temperature range of his body from 36 to 37 degrees, which is not viable without air, incapacitated without water and without food, and which is susceptible to all kinds of diseases, eventually grows old and dies, turning into dust and ashes.
There are no idioms in which the word “Spirit” would have adjectives next to it: American, English, French, German, Japanese, Canadian, Italian, because in the souls of the people of these peoples there is no True Faith in God, who is the source of this Spirit. These people mistakenly believe that the commandments given by God: “do not kill”, “do not steal”, “do not bear false witness”, “do not covet other people's property,” “do not commit adultery” must be fulfilled only within their society in relation to only each other, and it is not at all necessary to observe in relation to all other peoples inhabiting the Earth.
The souls of these people are seriously ill and people do not know that the only medicine for healing souls is the Orthodox Christian Faith, given to people by God himself.
Poor people with sick souls are spiritually disoriented and believe in anything, but not in the True God in three hypostases - God the Father, God the Son Jesus Christ, and God the Holy Spirit.
The reason for such disbelief is, first of all, a lack of understanding of the Orthodox Christian Faith and the Teachings of Jesus Christ regarding the reasons for the appearance and growth of human evil, and secondly, a categorical reluctance to understand this.
The situation with the lack of understanding of Orthodoxy and the unwillingness to understand it by the collective West, led by the United States, at first glance, looks hopeless for the Russians. How can you understand something if there is no such desire. Where does the desire to understand come from? How can a sick soul that does not consider itself sick be cured?
But this situation is not hopeless and not hopeless, there is a solution to the problem of misunderstanding. The peoples of the so-called collective West can rediscover the True Orthodox Christian Faith that their ancestors had when the Church of Christ was one.
But this requires the efforts of all people - both those who have the True Christian Orthodox Faith and those who have lost it or did not have it at all.
First of all, all Orthodox Christians must constantly pray to God to breathe into the sick souls of people a desire to show interest in his Divine Teachings of Love for people.
Then, sick souls, having acquired the desire sent by God, must turn with entreaties to God to show them the full severity of their fall and, realizing all their sinfulness, beg to let their minds understand his Divine Teaching for the healing and salvation of the soul.
The peoples of the countries of the collective West are in the state of old peoples, and are guided in their lives by the Old Testament commandments, which have long remained in history along with those Old Testament people to whom they were given and replaced by the New Testament, given to new people personally by God Jesus himself. Christ, who explained all the unacceptability of the Old Testament commandments previously given by God to the old people and indicated the reasons.
Fulfillment of the Old Testament commandments by new, no longer Old Testament people, "An eye for an eye and a tooth for a tooth" contributes to the emergence of hatred and revenge in human relations, which lead to the unrestrained growth of evil due to the fact that the offended, who is exposed to evil, always takes revenge on the offender by repaying responding with more evil, thereby increasing evil. It is a big mistake to think that evil is defeated by evil.
Christian teaching says: “Do not resist evil” (not evil, namely evil), which does not mean at all a refusal to protect the innocent and punish the evil, which is the direct responsibility of the authorities.
When it comes not to your salvation, but to the salvation of your neighbor (no, not a relative, but the one who just happened to be next to you, whom you may see for the first time and do not know at all), then resist evil, do everything in your power, to stop evil.
But when the offense touches personally and only you, and when there is no harm to others from it, and you begin to overwhelm with the feeling of revenge, only then do not resist the evil, endure the offense, endure the evil, because fire cannot be extinguished.
Christian teaching says: "If someone hits you on the right cheek, then turn to him and the left." That is, you need to conquer evil with your gentleness and generosity. By doing this, you will not feel a sense of resentment, you will make your offender ashamed and with your meek patience you will turn him from your enemy into a close friend.
Christian teaching says: "Give to the one who wants to take something from you more than he wishes." That is, you need to show your gentleness not only when you are beaten, but also when you are deprived of your property.
Christian teaching says: "Whoever forces you to go one mile with him, go with him two." That is, if someone unjustly forces you to hard exhausting work, then do not regret your body, work under compulsion for another, if you see that with your unrequited meekness you can save his soul.
Jesus Christ says that evil is conquered only by Love and teaches people how to overcome evil, appeals to people not to repay evil for evil, to endure not only offenses and deprivation of property inflicted on them, but also not to pity themselves when Love can defeat enmity.
Hit on the left cheek, substitute the right one; give to the robber in excess of what he wishes; work like a slave for the sake of the salvation of another - all these Holy Divine Commandments are not to the liking of either the peoples of the United States or the peoples of Western Europe, who believe that only weak people, to whom they do not attribute themselves, can live according to God's Commandments. But how wrong they are about the weakness of such people!
A person who experiences insults and humiliation, and at the same time does not harbor any anger and hatred towards his offenders, but sincerely loves them and prays to God for their understanding and salvation, has such a Power of the Spirit that no one else has.
The Holy Spirit dwells in the body of such a person, and the power of such a person is supernatural, and this power is given only by God himself. Such a person is able to see the future, heal the sick, raise the dead, move outside of time and space. People call such a person a Saint.
Such a person is a Pleasure of God, because he built his earthly life on the example of the life of God Jesus Christ himself, who at the end of his earthly journey, crucified on the Cross and pierced in the ribs with a spear, languishing in insanely excruciating pain, except for love for his offenders, did not experience anything and He prayed to God the Father for only one thing - to spare the souls of his executioners.
Such a person, being in body on Earth, in soul is already with God in His Kingdom of Heaven. After such a person leaves earthly life into eternal life, his body remains incorrupt, because the Holy Spirit dwelt in him. Through the prayers of people addressed to this Saint, he becomes a supplicant for them before God and their intercessor.
The relics (from the word power, strength) of such a Saint, which during his life were flesh, similar to a vessel that contained the Holy Spirit and themselves became Saints from this, staying in the temple of God, sanctify him and all his parishioners, granting everyone according to his faith healing from disease and vitality.
Taking into account the current spiritual state, or rather its complete absence, can this doctrine of Love for people, given to people by God himself, be understood and accepted by exceptional peoples that make up the so-called collective West, led by the United States, who consider themselves more worthy people, because they have the right skin color, the right skull shape, the right nationality, the right state structure, because they are richer, well, or simply because they decided so, and therefore, on this basis, they are allowed to rob and kill other people who can be considered people of the second, third or some other sort, or not to be considered as people at all? Of course not!
The material well-being of the peoples of the collective West, led by the United States, is directly related to the positive dynamics of the GDP of their states, and the richer they are, the greater the share of their GDP in the world GDP.
History has shown that the material situation of the peoples of the collective West always deteriorates sharply when they want to improve it at the expense of the Russians. Therefore, it is reasonably possible to assert that the future positive dynamics of the indicators of the share of GDP of the countries of the collective West in world GDP is critically dependent and predetermined exclusively by the Russian Spirit. In this regard, it is necessary to explain what it is, what its nature is and where does this Russian Spirit come from, which from century to century kicks assholes every time, after which their material well-being, for the sake of which they all live and which is the meaning of their whole life, evaporates sharply.
The Russian Spirit takes its roots in the Orthodox Christian Faith. To understand what the Russian Spirit is and where it comes from, you need to know what the Orthodox Faith is, where and how this Faith appeared on Earth and came into people's lives.
For a clear understanding of the essence of everything that is happening now in the World, whether in politics, economics, or in all other spheres of human life, even in medicine and sports, a clear and correct understanding of what happened in the world 2000 years ago is necessary.
The modern chronology, leading from the Nativity of Christ, testifies to living people about the events that took place then on a cosmic, universal scale, which were able to draw a line in the minds of people and divide time into an era before and an era after the Birth of Jesus Christ.
This event was the coming to Earth of the Son of God Jesus Christ, who gave people the Teaching about Faith in the True God, which subsequently influenced the entire course of world history and determines this course of history to this day.
The life of an individual person is not something discrete, consisting of separate events in the life of this person, independent of each other, from his birth to death, but a continuous series of events arising from one another and interconnected with each other. The same can be said about the life of peoples and states formed by them.
To know the future, knowledge of the past is necessary, because events that occur in the present are always caused by events that have occurred in the past and are always the basis for events that will occur in the future.
If a foundation pit was dug yesterday, today there will be a foundation, tomorrow there will be walls, and the day after tomorrow there will be a roof. This uncomplicated principle of following lies at the basis of the entire construction of our life and history.
If you want to see the future, always look to the past. The ability to see the events of the future allows the analysis of the events of the present with reference to the events of the past. People who do not understand this will never be able to build their beautiful future.
The Russian people from the moment of the Baptism of Russia by the Holy Equal-to-the-Apostles Prince Vladimir and the adoption of the Orthodox Faith throughout the whole time is a people that abruptly changes the course of history and on which the fate of the rest of the peoples of the world depends. This fact cannot be denied. This means that it is necessary to understand the Orthodox Faith of the Russian People, after the adoption of which, he began to play a decisive and decisive role in the fate of the entire human race on Earth.
People who do not know anything about the True Faith in God only think that these are some relics of a dense past. Nothing like this! Knowledge of the Orthodox Faith in the True God endows a person's life with meaning and gives an understanding of everything that has happened to him, is happening and will continue to happen, including after his end of earthly life.
Let's start with the fact that God is Love and only for this reason he created man in his own image and likeness, and breathed his soul into him. God is our Father, and we are his children.
When a son asks his father for bread, will he give him a stone? Of course not!
Likewise, we are like children who are in some need and cry out to God, "Our Father!" shall we receive from Him what is not useful to us? Of course not!
As a father who loves his children punishes them in order to educate them, so God punishes whom he loves.
A person's life is filled with trials sent by God to everyone according to his strength, for his correction and strengthening in faith. The Spiritual Law says that the further a person moves away from the True Faith, the more serious trials in life will await not only him himself, but also his entire family up to the third and fourth tribes, which is directly stated in the Holy Scriptures by God himself (Ex. 20: 5):
“Do not make for yourself an idol and no image of what is in heaven above and what is on earth below, and what is in the waters below the earth,
do not worship or serve them; for I am the Lord your God, a jealous God, for the fault of the fathers who punishes children up to the third and fourth generation, who hate Me,
and showing mercy to a thousand generations to those who love Me and keep My commandments".
When trials are encountered on the life path of a Russian Orthodox Man, he never succumbs to difficulties and does not give up, does not fall into despondency, and even more so does not commit suicide, because he always knows that all trials are allowed to him by God according to his powers for his own benefit, for his correction and strengthening in the faith. In difficult moments of life, the Russian Orthodox Man mobilizes all his strength and directs all his aspirations to a worthy passage of difficulties, after overcoming which he certainly becomes stronger and wiser, strengthening in the True Orthodox Faith.
But when the trials sent are so serious and so dangerous that death, whether violent or from illness, prevents them from being overcome, the soul of the Russian Man begins to cry out in prayer to God, asking for his mercy. And then the Holy Spirit descends on the soul crying to him and transforms it, endowing it with the Power of the Spirit according to the power of its faith.
Russian Orthodox People, in whose souls this divine Power of the Spirit dwells, and are thus the Russian Spirit. And then, before such Russians, no one and nothing can resist, such Russians cannot be defeated, such a Russian becomes capable of overthrowing even the most absolute evil, because the Power with which they defeat evil is given to the Russian by God himself.
A Russian Orthodox person who is in communion with God and asks for what is needed for life does not receive what he wants on a silver platter, but only the strength he needs to cope with his need and strengthen his faith.
It was the Russian Spirit who defeated the absolute evil that rebelled against him in the face of the countries of Western Europe in the Second World War. At the cost of 27 million lives of their compatriots, the Russians paid not only for their right to live, but also for the right to live freely for more than two billion other people who freed themselves from the colonial yoke of countries that are part of the group of gop-stops.
The peoples of Western Europe, unlike the Russians, prospered due to the robbery of their colonies and the oppression of the peoples living in them, and always envied the Russians, who were their antipode and hated them for this, and after the defeat in World War II, they began to hate the Russians even more. the former because of the loss of their colonies and the possibility of continuing to plunder them.
The Russians, having won a victory in the Second World War over the collective evil emanating from the countries of Western Europe, saved, without any exaggeration, the whole World from falling into the abyss of hell, including the European peoples themselves, who created this evil.
After all the savage atrocities committed by the German people against children, wives, mothers, the elderly, the Russians, having every right to completely destroy the entire German people along with their state, did not do this for a simple reason - because of love for the German people. The Russians were not overwhelmed by hatred against the German people, because the Russians fought not against the German people, but against the absolute evil that had captured this unfortunate people. The German people now live on Earth only thanks to the Russians and must remember this forever.
It was the Russians, and no one else, who saved the World in the bloodiest war in the history of mankind - World War II.
The world in which we live definitely consists of two worlds - the material, which we feel with the organs of our bodily touch, and the spiritual, which is felt by our soul.
In the material world, there are laws that describe the behavior of the matter around us, for example, the law of universal gravitation with which everyone is familiar and the consequences of which everyone felt on themselves in winter during ice after landing on the fifth point as a result of a fall, well, or the less well-known law of constructing nonlinear fractal structures dynamic additive-synergetic systems, which also works regardless of whether someone knows about its existence or does not.
In the spiritual world, there are laws concerning the human soul, for the understanding of which God came to Earth and gave people the Holy Scriptures. The laws of the spiritual world, like the laws of the bodily world, work in relation to people regardless of whether they know anything about these laws, or do not know whether they believe in the existence of these laws or do not believe, whether they deny these laws or accept whether they agree with these laws or disagree.
Spiritual laws act in relation to people as inevitably as material laws.
For example, a person agrees with the law of universal gravitation or disagrees, whether a person knows about this law or does not know, but going out into the street through the window of the 10th floor of his apartment, the force of gravity organizes his fall with an acceleration of 9.8 m / s² with everyone tragic consequences for him. Knowing for themselves the inevitability of these tragic consequences, people do not go out through the windows.
Exactly the same is the case with spiritual laws, a person's lack of knowledge of which does not free him from tragic consequences as a result of his actions contrary to these laws.
Holy Scripture consists of the Old and New Testaments. The New Testament consists of four Gospels written by the Apostles of Jesus Christ, the Holy Spirit himself guided by the hand and pen.
A complete and clear understanding of the Holy Scriptures is given only to Holy people, according to the strength of their righteous life. Simple sinners, which we all naturally are, should not dare to independently understand what is stated in the Gospel and interpret it "from the wind of his head." After reading the Gospel, in order to understand everything stated in it, it is necessary to turn to the explanations of the Holy Fathers set forth in their numerous works that have survived to our time, written in the state of the Holy Spirit being in them.
No matter how strange it may sound, but for a complete and clear understanding of all events and processes occurring in the World, whether in politics, economics or elsewhere, they must be viewed through the prism of the Holy Scriptures of both its Old Testament and the New Testament with a description of the teachings people build their lives for the salvation of souls in the True Orthodox Christian Faith, given by God himself.
The difficult, tragic fate of the Jewish people, who is in the fall and unauthorized distance from God, as a result of which, with the hardest trials and the loss of their state for many centuries and almost completely physically disappeared from the face of the Earth, at first accurately predicted by unsuccessfully trying to stop the fall of the Jews by the Old Testament prophets, and then, expected by the Jews of the coming of the Messiah, who himself came to them personally by God Jesus Christ unsuccessfully tried to return the Jewish people to the faith and prophesied with the words “Truly I say to you, there will be no stone unturned here; everything will be destroyed ”(Matthew 24: 1,2), in which they, the Jews, God's chosen people, did not recognize their God and did not want to understand and accept his Teachings, and to those killed by them with the most shameful and cruel executions, makes them think seriously about the predictions of the Old Testament prophet Ezekiel, who lived in the 6th century BC, and the Apostle Evangelist St. John the Theologian regarding the northern people of Ross, which is currently the Russian People.
If everything predicted by the Old Testament prophets in relation to the Jewish people came true with amazing accuracy, then there is no reason to believe the opposite in relation to the predictions of the same prophets regarding the Russian People and in general other predictions that are made in relation to everything else and are described in the Holy Scriptures.
The Prophet Ezekiel, in his book of prophecies, writes about the large number of the northern people called Ross, which must achieve tremendous material development before the end of the World and conclude with its end the history of the existence of the entire human race on Earth.
John the Theologian in the Apocalypse writes about the power of the northern people of Ross, pointing out the large number of troops, which in this state will be likened to the sand of the sea.
It is easy to understand that in the prophecies of Holy Scripture, when mentioning the northern people of Ross, we are talking about the Russians, about the Russian State, now called the Russian Federation.
Based on the texts of the Holy Scriptures, it can be argued that
- the Russian State will never cease to exist and will always remain in the history of mankind;
- the end of the history of the human race will occur with the end of the existence of the Russian People;
- the Russian State will inevitably become a state developed in all spheres of human activity that one can imagine in the future.
The army, likened to the sand of the sea, indirectly indicates the huge population of the Russian State. If the military is not counted, how not to count the sand of the sea, then it will also be impossible to count the civilian population.
Russia is a state that has determined, determines and will always determine the future development of mankind until the last moment of its existence on Earth.
In this case, the United States needs to calm down and come to terms with the fact that the people who determine the future of all mankind on Earth, according to the Holy Scriptures, and therefore by the will of God, will always be the Russian People, and not the American.
And all exceptional peoples, first of all the peoples of the United States, who consider themselves to be people of the first grade, in order to see their future destiny, it is necessary to look very carefully at the destiny of the Jewish people, which, being God's chosen people by the Providence of God, was to become for other peoples the conductor of the Divine Teachings about God as about God the Trinity, one in God the Father, God the Son and God the Holy Spirit, and chose a different destructive path, imagining himself to be an exceptional people.
Jewish prophets, one after another, predicted the coming of the Messiah, who would appear to the Jewish people and conquer all the peoples of the world. The constantly persecuted Jewish people looked forward to the coming of the Messiah, with whom they associated only their material well-being and prosperity on Earth.
Being in a state of spiritual decline, and even under the yoke of the Roman Empire, the Jewish people dreamed not of their spiritual rebirth, but of how God, who personally handed the stone tablets to Moses, and whom they so much wait for, will appear to them in the person of a mighty The king on horseback in golden armor and with a large army, which will defeat the Roman Empire, under the yoke of which he is and will conquer by force all the other peoples of the World, making the Jewish people the most powerful and dominant over the rest of the peoples.
Everything happened as the prophets proclaimed. The Messiah really came to the Jewish people at a time when they were in spiritual decline and most urgently needed God, and the Jewish people renounced their God.
God sent his Son Jesus Christ to earth, who was conceived by the Holy Spirit in the body of the immaculate Virgin Mary and was born into the family of the poor carpenter Joseph the Betrothed in Bethlehem.
Jesus Christ grew up and began to preach the word of God to the Jewish people, saying that He is exactly the Messiah, about whose coming the prophets spoke and who came to save the Jewish people, confirming this with performed miracles. And on the eve of the great feast of the Jewish Passover, riding a donkey, Jesus Christ appears to the Jews in Jerusalem and denounces the scribes and Pharisees of the hypocrisy and fall of the Jewish people.
The Jews who were waiting for the mighty Tsar in golden armor on a horse with a powerful army, and who saw in front of them a beggar carpenter's son on a donkey, accompanied by the same poor and uneducated fishermen, did not see Jesus Christ sitting on a donkey, preaching the doctrine of God as the God of Love and the immortality of the human soul, that militant God, capable of making other nations submit to the Jewish people.
Could the Jewish people, being in such a fall, who was chosen by God, who imagined themselves to be an exceptional people, to whom all other nations should obey, accept the teaching of the True God Jesus Christ about love for one's neighbor? Of course not!
Feeling themselves exceptional, the Jewish people rejected the True God Jesus Christ, crucifying him on the Cross, after which the bitter consequences for the Jewish people did not take long to wait.
The economic development of the Russian State is mistakenly associated with investments, and even those that came from the hop-stop countries. Such thoughts, at the suggestion of the United States and the countries of Western Europe, within the Russian State are broadcast by traitors who do not want anything good for their Motherland.
The very idea of no investment is stupid, and the lack of Western investment is generally idiotic. Investment is money, and money is easy to print. As the Americans show, the amount of money printed is limited only by the productivity of the printing press.
The Russian State has everything for economic growth, except for one and the most important thing - the population corresponding to its vast territory, which would generate appropriate business activity and ensure stable domestic demand.
Just as a broken starter motor in a car with a full tank of fuel does not allow the engine to start and accelerate, picking up speed, so the insufficient population in the Russian State does not allow the economy that is standing still to start. A sufficient population is the very starter without which the economy cannot be started. The engine of a small passenger car with a manual transmission can be started without a starter, so to speak from a “pusher”, but how to start a truck like BelAZ-75710 from a pusher? No way.
The main problem of the growth of the economy of the Russian State is the lack of growth in its population. To clearly understand that this is so, it is enough to look at the population growth rates in India or China and relate it to the rates of economic growth of these countries, especially in the previously absent sectors of the economy.
The twentieth century for the Russian State was the most catastrophic in its history with the loss of a colossal size of territories and a terrifying decline in population, which took place throughout the last century in the course of the following tragic events one after another:
1. World War I;
2. Revolution and disintegration of the Russian Empire, followed by the Civil War and mass emigration of the population;
3. Repressions in order to retain power and prevent the collapse of the state in the post-war years;
4. World War II;
5. Repressions in order to retain power and prevent the collapse of the state that was in ruins;
6. The collapse of the Soviet Empire with subsequent military conflicts along the entire border and within the state, accompanied by one after another economic crises, high mortality and mass emigration of the population.
In general, if not for all this horror, then the population of the Russian State at the moment could be not 145 million people, but 500-700 million and even more.
The reason for all this nightmare with the decline of the population, which began with the Russian World at the beginning of the last century, is the same - the spiritual degradation of the Russian People. The overwhelming majority of Orthodox Russian People fell into sin, turned away from God and renounced their Orthodox Faith. Even the seminarians of theological seminaries where the Word of God was taught, who chose the path of serving God carrying His Teachings to their people, did not have faith in God, and then, like the Jews who crucified the Lord God Jesus Christ on the Cross, crucified God in their souls, took up arms in the hands and in the first ranks of the revolutionaries went to do lawlessness: to kill, rape and plunder their own people, destroying the Faith in the True God along their bloody path, desecrating Temples and blowing up Churches, shooting the Priests and all Orthodox Christians who refused to abandon their Faith in the True God Jesus Christ.
The progressive liberal-satanic ideas about freedom that came to the Russian Empire from Europe, including from their conscience, and therefore from God, expressed in complete permissiveness, took possession of the minds of the Russians, who, due to their spiritual weakness, could not resist them. As the saying goes, “The road is wide without God,” and this wide road, which they themselves chose, led the Russians to fall into the abyss. The sad fate of the Jewish people, who rejected God, did not teach the Russian People anything.
The tests that the Russians had to go through in the first, second, third and fourth generations, according to the Spiritual Law (Ex. 20: 5), show the full severity of their fall from sin 100 years ago.
God punishes whom he loves and gives trials according to their strength. All the tragedies that occurred in the fate of the Russian People after their renunciation of God were called upon to correct the Russians, to make the Russians stronger and to strengthen the Russians in their Orthodox Faith.
The whole horror of what is happening to the Russian People can be understood by the way the head of state, being a student of a theological seminary in his youth, and already in his youth an ardent fighter against God, in the first days of the Great Patriotic War, addresses his people with the words not “Dear comrades”, but “Brothers and sisters ”and remembering the Russian Spirit of the commander and defender of his Fatherland Alexander Nevsky, reckoned by the Russian Orthodox Church to the Face of the Saints, and other great Russian generals with the unbending Power of the Spirit who professed the Orthodox Faith, the true sons of their Fatherland, who fought without sparing themselves for their Motherland, calls to be equal to their great ancestors, who have always defeated their enemy.
The most terrible war in the history of mankind, unleashed by the German people, who set themselves the goal of the complete destruction of the Russian People, showed the whole world of the Russian Spirit in its full growth.
The war has shown and proved to the whole world that the Russian Orthodox People is the foundation on which the Russian State stands, namely the Russian People, and not any other people living together with it. This fact is well demonstrated by examples of the combat effectiveness of military formations only on the condition that the share of Russians in the personnel of soldiers is at least 75%, and the remaining share is made up of the rest of the peoples who, shoulder to shoulder, back to back, together with the Russians, also bravely fought and died heroically for their homeland. If, during combat losses, the share of Russians in the personnel of a combat unit fell below 75%, then in order to increase its combat effectiveness, the personnel were obligatory replenished with Russian fighters in order to increase their share to a level not lower than 75%, and if such replenishment was impossible, combat the unit was subject to disbandment as incapable of combat. The Russian People should be understood as both Ukrainians and Belarusians, because Russians, Ukrainians and Belarusians are one in the Orthodox Faith, they are the essence of one Russian People.
The history of combat battles in the Great Patriotic War showed that only Russian commanders who possessed the Power of the Spirit could stand up to their full height against heavy fire and raise their fighters into attack, into hand-to-hand combat against the many times superior enemy forces. Behind such Russian commanders, under bullets, Russian soldiers and soldiers of other nationalities stood up to their full height.
For the attack to take place, it is necessary that the entire composition of the combat unit as one obey the orders of the commander and rise to the attack with him. This was achieved on the condition that one soldier of a different nationality required at least four Russian soldiers, who rose to meet the flying bullets, so that he went on the attack with them.
Subject to the death of Russian soldiers and a reduction in the share of Russians in the personnel, the attack was choked, because there was no longer that necessary concentration of the Force of the Spirit that unites all, which made a person capable of continuing to meet flying bullets, that is, to death. And this is an indisputable fact, as well as the fact that there was not a single unbeliever in the trenches before the attack.
The Russians possessed such a Power of Spirit that, going on an attack under heavy fire, they simply plunged the Germans into shock and horror, forcing them to keep running away from this Power wherever they looked, and not having time to escape and entering into hand-to-hand combat, the German scum was crumbled by sapper blades just a vinaigrette.
The Great Patriotic War is sacred for the Russians and the appearance of the Immortal Regiment to the people is not accidental, it is intended to make the Russians understand that they, the Russians, are the very people who throughout their history have been the very foundation on which the Russian State stands. It is the Russian People, and not some other people living with it, that bears full responsibility for the development of the Russian State and the prosperity of all peoples living together with them.
100 years ago, having renounced God and renounced their history, the Russians lost the link between generations. Little by little, this connection begins to be restored, which is well demonstrated by the awareness of the Russians, standing shoulder to shoulder in the Immortal Regiment with portraits of their ancestors, that it was they who are now living, it was they, and not their grandfathers, who won that terrible war, having won the upper hand over the absolute evil in the person of Germany and the countries of Western Europe.
The link between generations will be fully restored when the Russians living today realize that everything that happened in the past: all victories and all defeats, all joy and all sorrow, happened with them, now living, and not with their ancestors; that it was not their great-grandfathers, but they, in 1917, rejected God and destroyed churches, unleashed a civil war and destroyed their Great Russian State, organized terror and shot innocents, destroyed the Orthodox Faith, killing Priests and Christians who refused to renounce their faith; that these were not their grandfathers, but they, after the Great Patriotic War, organized repressions, wrote denunciations against each other and exiled each other to the GULAGs; that it was not their fathers, but they, in 1991, again destroyed their state.
Great-grandfathers, grandfathers, fathers, sons. Four generations have passed since the Russians renounced God. According to the Holy Scriptures, the fourth generation will drink the bitter cup of trials for apostasy from God. The Russians, having gone through all the trials, in their fourth generation returned to the fold of Orthodoxy.
The young, fifth generation of Russians, who are coming to replace them, is obliged to know well their Orthodox Faith, the entire history of their people and understand that the Russian State has no future outside of Orthodoxy, that the cause of all troubles and upheavals is the same - this is spiritual degradation caused by a deviation from the Orthodox Christian Faith.
Russians living today should know that 100 years ago the countries of Western Europe had a hand in the collapse of the Russian State, they sponsored, directed, played off, incited, but all the blame for the collapse of the Russian State lies entirely with the Russians, who could not withstand the aggression because the poor in spirit were and all the iniquities that inevitably led to the collapse, they committed themselves, with their own hands.
So that nothing similar to what happened in the last century will be repeated with Russians in the future, they must know and understand the teachings of Jesus Christ, profess the Orthodox Faith, always be spiritually strong and keep their Faith from encroachment, because Orthodox Faith is a Gift of God, which needs to be stored like the apple of an eye.
The collapse of the Russian State, which began at the end of the last century, was stopped at the beginning of this century by the incredible efforts of its leader and people, who showed courage, incredible willpower and tremendous Power of Spirit, and did the impossible - not only stopped the processes of destruction of the Russian State launched at the end of the last century, but having ensured its safety, he began to implement programs of economic growth.
The power of the Russian State understands the impossibility of economic growth without population growth and is taking the right measures to stimulate the birth rate and raise the level of medicine, education, social support for all segments of the population, to equip a comfortable living environment with the simultaneous implementation of steps to build infrastructure with the prospect of population growth as close as possible to raw materials resources of territories, which will surely become centers of development in the future.
Everything that the authorities do to increase the birth rate, creating the most comfortable conditions, is a necessary and necessary thing for the people. But the attempts of the authorities to stimulate an increase in the birth rate by creating comfortable and favorable living conditions can be compared with attempts to paddle an aircraft carrier.
The authorities and the Russian people must realize that it is not an increase in the number of warm trials that leads to an increase in the birth rate, but an increase in the spiritual state of the people is the very trigger that triggers the growth of the population. The entire history of the Russian State clearly testifies to this, showing bursts of birth rate precisely against the background of events accompanied by the spiritual upsurge of the Russian People, which is in no way connected either with the presence of its good financial situation or with the presence of comfortable living conditions. The high level of spirituality of the people will correspond to an ordinary Russian family, in which from 8 to 13 children are born.
There is a direct link between economic growth and the spiritual state of Russians. It is with the emergence of large and strong Russian Families that the process of development of the Russian State will begin. Families of 10-15 people cannot live in ordinary apartment buildings, so the Russian State must be one-story throughout its entire territory.
The spiritual growth of Russians will necessarily be accompanied by an increase in the population of the Russian State, as a result of which economic growth will begin with the emergence of industries in the economy that produce high-tech products that are in demand throughout the world and have no analogues, the production of which will not be possible in other countries. The Russians will provide themselves with a transport opportunity for movement across their vast territory across the entire continent from their western borders to their eastern borders in a time not exceeding an hour.
A strong person is, first of all, a spiritual person. A person is truly strong if he is developed both spiritually and physically. The authorities must deal with the physical health of a person. The state should take care that there is a healthy mind in a healthy body.
Spiritual education of a person lies in the plane of the Orthodox Faith. The responsibilities of spiritual education first lie on the shoulders of the parents, and then on the shoulders of the Russian Orthodox Church, established on Earth by God himself.
Power cannot engage in the spiritual growth of a person, because the Orthodox Faith, in which a person becomes spiritually developed, is a Gift of God, which, naturally, no one, no one, can ever impose.
In order to raise children in the Orthodox Faith as spiritually strong people, the parents themselves must live in the Orthodox Faith according to the commandments of God and be an example for their children.
The spirituality of the Russian People, revived with the disintegration of the atheist state, is at a very low level. The overwhelming majority of Russian Orthodox people are, as it were, in nominal faith, considering themselves Christians, but extremely dismissive of the constant compulsion of themselves to live according to the commandments of God due to the lack of understanding of the fullness of their Faith, that Faith without works is dead.
Many people replace the concept of spirituality with the concept of morality. A spiritual person is always a moral person, but a moral person may not be a spiritual person.
Morality is the base, it is the minimum, it is self-evident. People, however, are not delighted with a person who, for example, today has not killed, stabbed, robbed, raped, deceived and stole nothing.
Spirituality is very different from morality. Spirituality is about the soul of a person; this is what happens inside him, in his thoughts, in his soul; this is something that is not visible and inaccessible to any of people, something that only he and God knows about.
A person by his behavior in society can be a model of morality, and in his soul he can hate, envy, condemn, be angry and do other things that destroy his soul.
Maintaining physical health requires a person to eat well, maintain a healthy lifestyle, and exercise consistently to increase and maintain muscle strength by exercising on a regular basis.
Maintaining spiritual health requires much more effort from a person. Awareness of the complexity of controlling all his thoughts and feelings comes to a person after he tries to live at least one day, so as not to be angry with anyone, not to condemn anyone, not to envy anyone, not to be offended, not to be rude to anyone, not to quarrel with anyone, not to use foul language, not to wish any harm to anyone, and so on the list.
The development of spirituality is hard work on oneself, and the only obstacle on the path of spiritual development is a person's laziness and his unwillingness to work on himself.
Christian teaching says that breaking the commandments of God is a sin, and when a person commits a sin, he wounds his soul. The life of a person in sin is the destruction of his soul. Sin is called passion because it brings suffering to the soul.
The Orthodox Christian Faith speaks of a person with a pure soul as a person free from the passions listed below.
All of the above listed sins are diseases of the soul. Every sin that a person commits inflicts a wound on the soul. Like all diseases, sins are light and heavy. A slight sin inflicts a slight wound, a grievous sin a grievous one.
One sin, the second, the third, the fourth, the fifth, and the human soul becomes callous, the person ceases to sympathize, empathize, sympathize, love, turning into an animal.
All light sins ultimately lead a person to serious sins. For example, first deception, then theft, then murder; well, or at first laziness, then envy, and then murder; or suicide, preceded by disbelief and discouragement.
A person experiencing a disease of his body will run around all doctors, drink any medicine and go to a dangerous operation just to get rid of the disease and cure his decaying body, which will still become earth and ashes.
The soul of a person is immortal and Orthodoxy calls upon a person to be concerned not with the temporary and empty, but with the eternal and meaningful, that is, with the health of his soul.
So who does Orthodoxy interfere with and why is there endless persecution of Christians in the world, to whom is this religion that calls people to live in love for each other without sin so displeasing? The answer is simple - to the devil.
A person who has accepted the Orthodox Faith and began to force himself to a life without sin, very soon begins to realize all his inability to do this, all his powerlessness to resist and resist sin, that is, the devil. Having understood all his sinful nature, a person should not despair, but call on God to give him strength to fight against sin. How many times a person has sinned, so many times he must repent and follow this difficult path of saving his soul further, until its very end, trying not to fall into the same sins.
The spiritual law says that sin must be suppressed by repentance immediately and immediately after it is committed, because the smallest sins left without repentance always lead to the most serious sins, plunging the soul into more terrible torments.
It can be said that the pure sinless soul of a person has similar properties with God, and just like a drop of pure water falling into a pure water source becomes part of it completely merging with it and completely dissolving in it, so does the pure soul of a person after his death, falling into the Kingdom of Heaven, can abide in him in eternal life next to God. The soul of the sinner, which differs from the soul of the righteous, in this case can be compared with a drop of mercury, which will not dissolve in pure water due to its different properties and will sink to the bottom. The properties that the soul of a sinner possesses will not allow it to be in the Kingdom of God.
The purpose of a person's life on Earth is that after death his soul will find eternal life in the Kingdom of God in a pure source, and not in hell at the bottom. And for this, it is necessary to live it according to the Commandments of God, and this is very, very difficult, since the Kingdom of God is in need of, sweat and blood is given to a person.
Descending from heaven to earth, we have to admit that the reason for the lack of development of the Russian State is the low level of spirituality of the Russian People. To understand this, it is enough to look at what Russian federal state television channels broadcast during prime time. Particularly outraged by what is happening on the main channel of the country, where a raging buffoon with unstoppable verbal diarrhea on the days of the Great Christian Feasts every time allows himself to express any abomination and vileness in relation to Orthodoxy and Christian Values, causing a normal person to desire similar to that which arises when seeing running cockroach.
Anyway, everything that happens in the Russian media just screams about our spiritual poverty.
One virtuoso in changing shoes in the air calls on compatriots to clean up the country. Such primitivism of the call is akin to calling on people to go to the bathhouse to wash themselves. Keeping your body clean and tidy will not drive demons out of your soul. Besogon, justifying its name, must urge people, first of all, to clean up their souls, literally, to clean up the Augean stables of their souls, which have not been cleaned for 30 years. As Hercules, by the riverbed, cleared the Augean stables that were clogged with manure under the ceiling, so did the Russians by reading the spiritual books of the Holy Fathers, giving soulful advice on how to wash away all the dirt and all the stench with a stream of clean water. Of course, you need to start not with appeals, but with yourself, not looking for knots in the eyes of your neighbors, but pulling the logs out of your eyes.
After the Russians clean up their souls, the need to clean up the country will disappear by itself as unnecessary.
An understanding of the Orthodox Faith would not be complete without an understanding of other religions. The statement that God is one is true because it is said so in Scripture.
If you look at other religions, then they are not different gods, but a different idea of God.
The judgment that God is one and in this case there is no difference between religions, because everyone believes and prays to the same God, is false and is aimed at the destruction of other religions and, first of all, Orthodoxy. This can easily be seen in the example of Judaism.
Jews professing the Jewish religion believe that the Messiah will appear to them, whom they will worship as a god and with whom they associate their prosperity on Earth and the conquest of other peoples. The Messiah came to the Jewish people in the person of Jesus Christ and was crucified by the Jewish people on the Cross. The Christian Faith, which he brought to the Jews, and which was rejected by the Jews, conquered other peoples of the World. Despite the fact of the coming of the Messiah to the Jews in the person of Jesus Christ and the conquest of other nations by the Christian Faith, the Jews deny this, because they want the physical conquest of other nations and continue to wait for the coming of the Messiah.
Scripture says that the next one to come for Jesus Christ will be the devil. This will be a man with supernatural abilities who will declare himself a god and force the rest of the nations to reject their faith and worship him as a god. Thus, it turns out that the Jews are not waiting for the coming of the Messiah, but for the coming of the devil, whom they will declare as their god.
In this case, how can we say that in Orthodoxy and in Judaism one and the same God? How can we say that there is no difference between a prayer addressed to God and a petition addressed to the devil? Of course not! There is a difference, and what a difference!
White and black cannot be considered one color, good and evil cannot be considered one and the same, one cannot equate God and the devil.
All who seek to substitute concepts by turning everything upside down and calling evil good, for example, making sexual perversion the norm, take the side of the devil and, destroying the Orthodox Faith, commit the most terrible sin of fighting against God.
It is necessary to know that it is in the Orthodox Christian Faith that the true understanding of God as the God of Love, triune in God the Father, God the Son and God the Holy Spirit is given. A great many reliable facts point to the extraterrestrial origin of the Christian Faith, indicating that this faith was given to people by God himself.
The only way to know the Truth is to try it yourself, because faith without works is dead. And doubts about the Truth of the Orthodox Christian Faith disappear after a person begins to live according to the commandments of Jesus Christ.
You cannot force anyone to believe in God, therefore Russians need to be an example of high spirituality for other peoples and constantly pray to God to grant these peoples the Orthodox Christian Faith for the salvation of their immortal souls.
After the Consecration of the Russian Land by the Apostle Andrew the First-Called almost 2 thousand years ago, including on the banks of the Dnieper, where Khreshchatyk is now in Kiev, the very Baptism of Rus by Prince Vladimir in 987-989 became the starting point of the formation and development of the Russian State as Orthodox.
Capable of developing only at the expense of plundering and destroying other peoples, gop-stop countries are throwing all their strength into building a "new world order against Russia, on the ruins of Russia and at the expense of Russia."
Understanding the Orthodox Faith, which is the backbone of the Russian People and the core of the Russian State, gives an understanding of the direction of vectors in the policy of the United States and Western Europe to curb the development of the Russian State in the direction of destroying its core and subsequent destruction, because all hopes for their development are the so-called civilized countries Western Europe, led by the United States, is associated only with the destruction of the Russian State and the plundering of resources located on 1/6 of the land.
However, the physical destruction of the Russians in a direct military conflict threatens the peoples of the gop-stop countries with their inevitable and instantaneous transition from one form of being to another form of non-being in the form of radioactive ash, or drops of mercury.
The Russian State will be a strong and strong state as long as the Russians are strong in their Orthodox Faith.
The most likely scenario for the US blocking the development of the Russian State will develop in the direction of decreasing its population.
The United States will strive to reduce the number of the Russian people by its actions aimed at reducing the birth rate and at physical destruction.
The United States will seek to carry out physical destruction of the Russians by using someone else's hands by unleashing military conflicts along the entire border of the Russian State, as well as using biological weapons developed by the United States in its biological laboratories located along the borders of the Russian State in Moldova, Ukraine, Georgia, Armenia, Azerbaijan, Kyrgyzstan and Kazakhstan.
The US plan for a quick global strike against the Russians as part of the creation of a missile defense system in Europe was not implemented and failed with a crash after the Russians created hypersonic weapons.
The United States would have started a full-scale war in Ukraine long ago if it had not been for the Russians' announcement of striking decision-making centers in this case, which severely limited the United States in its military aspirations.
The United States will seek to reduce the birth rate in the Russian State in two ways - by creating obstacles to the economic development of the Russian State, which in the form of all kinds of sanctions should “tear the economy to shreds”, depriving the power in the Russian State of the means to fulfill all its social obligations and destroying the Orthodox Faith, destroying Russian spirituality by propaganda of all kinds of sexual perversion and same-sex relationships.
Waging mental wars against the Russians is the only thing left for the United States.
Victory in mental wars aimed at changing the outlook of one's opponent is achieved in at least 2-3 generations.
The Anglo-Saxons began a mental war against the Russians almost immediately after the defeat in World War II, when, after the Fulton speech, which sounded to the whole world on March 5, 1946, on March 26 of the same year, the BBC Russian service began broadcasting, and on February 17, 1947, the first program went on the air. Voice of America in Russian.
The Russian State, destroyed by the war, closed its borders from the rest of the World and concentrated on its restoration. Anti-Russian radio waves from America and Great Britain, passing through all borders, like drops of water falling one by one on a stone, began its destruction.
The United States, without hesitation, will be the first to use nuclear weapons against the Russians if they are sure that the Russians will not respond, because the United States began its program to develop atomic weapons back in October 1941, and on July 16, 1945, it tested an atomic bomb first on a military test site, and then on August 6 and 9, 1945 tested atomic weapons on civilians, dropping first "Kid" on the city of Hiroshima, and then "Fat Man" on the city of Nagasaki. Having destroyed two peaceful cities with two nuclear explosions and killing more than 200 thousand people, the American people, who created absolute evil, came to indescribable joy and delight, showing the whole world all their devilish essence.
On August 29, 1949, after a successful test of their atomic bomb, the Russians thwarted all plans for unleashing a nuclear war in the World, after which the United States concentrated on a mental war against the Russians and seriously took up the thorough preparation of all its operations against the closed Russian State, waiting for the right moment for attack, which began in 1985 with the coming to power in the Russian State of the leader, who became a Russian Judas, who sold all his compatriots with the giblets for 30 pieces of silver, initiating with his leadership destructive processes within the state that led to its complete collapse.
The United States clearly and correctly calculated the directions for striking the Russians, which became the Orthodox Faith, history and education, with the aim of unbridling the Russians in order to bridle, since an uneducated people who do not know their history and without faith in God are a herd.
The Russians will never declare any mental war on anyone, because a lie is not Christian, because the strength of the Russians is only in the truth.
The Orthodox Faith of the Russians is the shield of the Russian State in the mental wars of the United States being waged against it, and Truth is the sword with which any lie and any evil that generates it will be defeated.
World politics and world economy are interconnected. The processes taking place in world politics affect the processes taking place in the world economy and vice versa.
Understanding the direction of vectors in the policy of leading world powers gives an understanding of the possible actions of states in the international arena and their consequences for the world economy, which are expressed in changes in the macroeconomic indicators of countries and the value of financial assets.
World politics is a tangle of confrontations between states, wound on each other, which can only be unraveled by knowing the history and psychology of peoples, subtly understanding the nation (its spiritual bonds) on which the state stands and the limits of what is permitted in relation to this or that state on the part of others states with all places where it is very thin and can tear.
Anticipating future processes in international politics helps to determine the future time and cost intervals of new fractals when analyzing fractal chart structures.
The converse is also true. If the fractal analysis of charts shows the completion of the time and cost intervals of fractals, then this allows one to foresee possible future decisions of politicians who will fit into the dynamics of certain indicators in strict accordance with the attractor to which the fractal structure of these indicators tends.
The ability to anticipate future decisions of politicians that affect the future dynamics of value in the financial market makes this computational technology based on fractal analysis in the hands of the head of state a real weapon in the political struggle in the international arena.
After all, who else, if not the head of state, is important to know about all possible future actions of his opponents, prescribing for each of their decisions a specific scenario of the subsequent development of events, indicating the likelihood of its implementation based on the data obtained by fractal analysis of graphs in order to act ahead of the curve.
It is worth noting that the United States is an active threat to the Russians, while China, with the prohibition of Orthodoxy in its state, is still a passive threat.
But no matter how strong the economy of the state that threatens the Russian State is, with the help of the Russian hypersound, this economy can instantly turn into the economy of a hyper-pipe.
Russians in this World have no one and nothing to fear, except for one thing - their spiritual impoverishment and the loss of the Orthodox Faith in God, because earthly life is given for the immortal soul to acquire a future worthy life next to God.
I would like to end the topic of the mental wars of the United States against the Russians with the statement of St. Ignatius Brianchaninov, an educated person who did not choose a career and a rich well-fed life, but devoted himself entirely to first searching for God, and then serving God, and left behind him like a valuable scattering of diamonds, a scattering of precious soulful texts written in a language understandable for future generations:
"Enemies will wake up, shake Russia, produce an involuntary development of power in it, but they will not humiliate Russia: they will elevate it, this is its predestination."
On this topic of the Russian Spirit and Orthodoxy, one can complete and continue the analysis of macroeconomic indicators reflecting the foreign policy and foreign economic aspirations of the United States, which are irretrievably losing their dominant position in the World as the destroyed national economies are restored and developed by the Second World War.
3.2.2.4. In relation to the GDP of other countries.
For an even more complete and clearer picture of everything that is happening with the US economy, the analysis of the dynamics of the ratio of US GDP to world GDP must be supplemented with an analysis of the dynamics of the ratio of US GDP to GDP of other countries.
The indicator of the ratio of the value of the US GDP to the value of the GDP of another state shows how many times the US GDP is greater or less than the GDP of another state.
Let us construct, for example, graphs of the dynamics of the indicator of the ratio of US GDP to GDP of the following ten countries:
1. China;
2. India;
3. Malaysia;
4. Hong Kong;
5. Indonesia;
6. South Korea;
7. Brazil;
8. Singapore;
9. Israel;
10. Ireland.
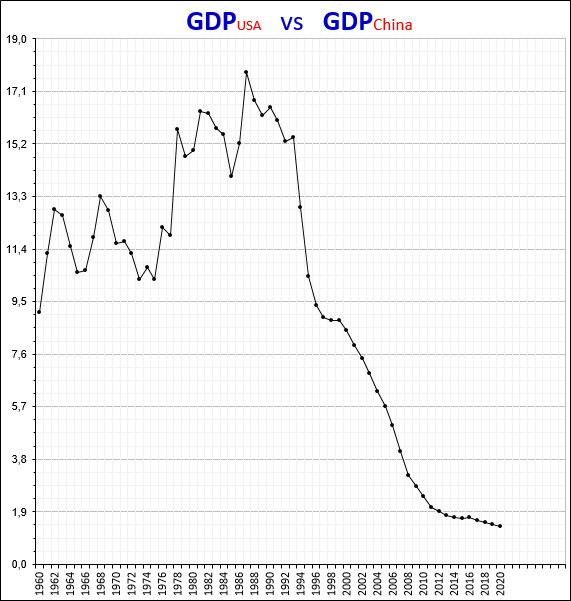
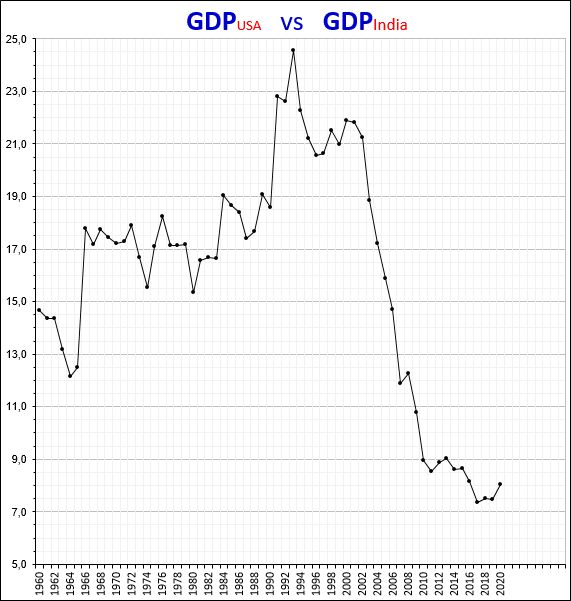
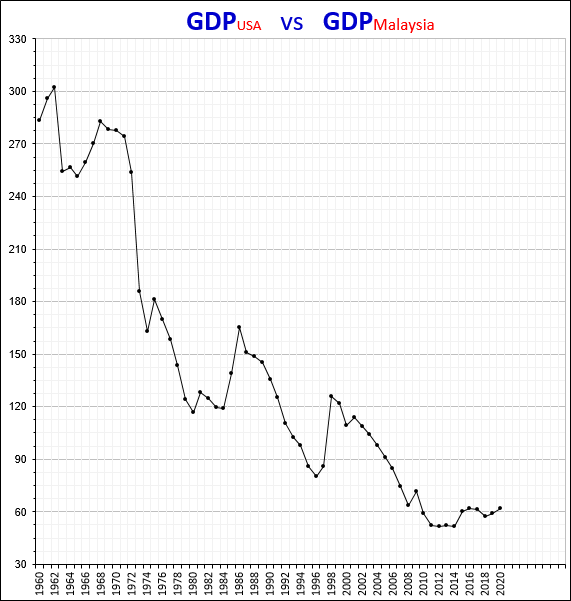
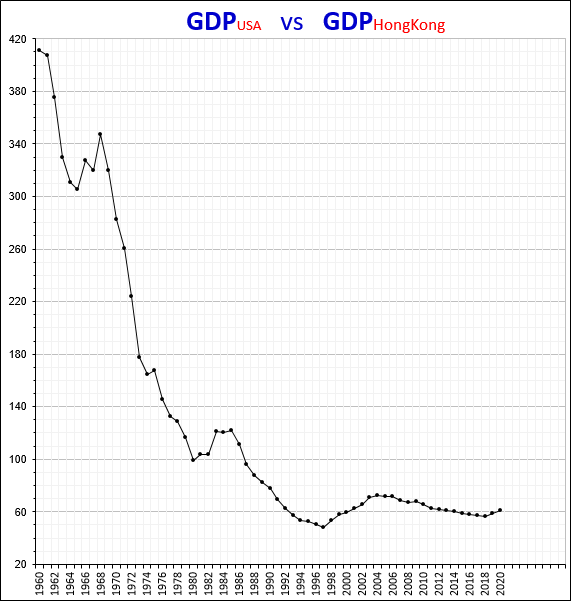
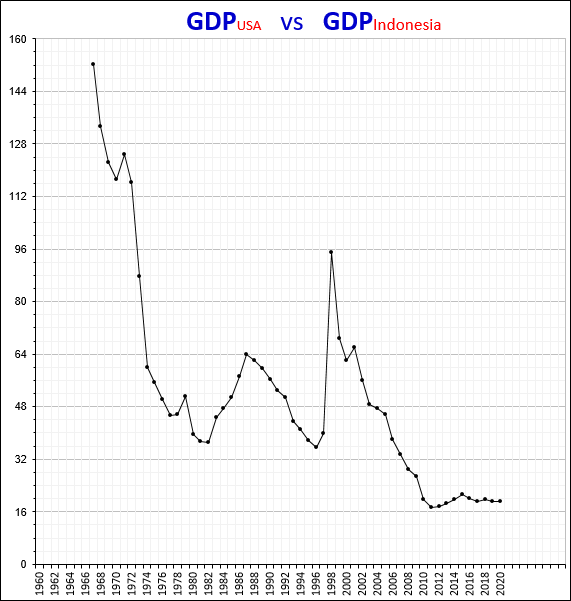
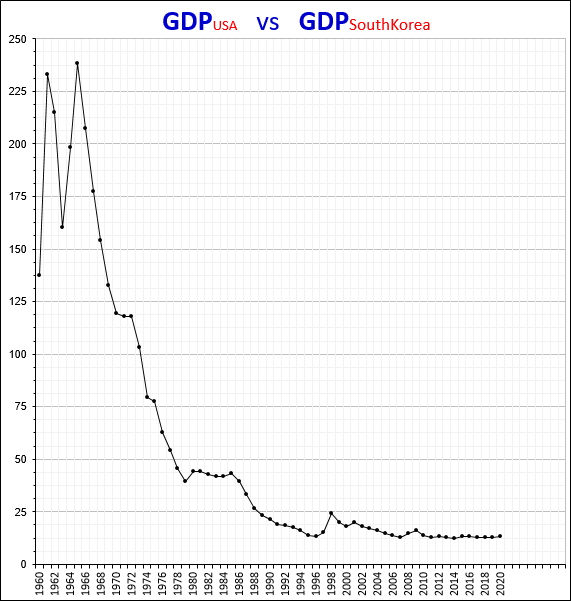
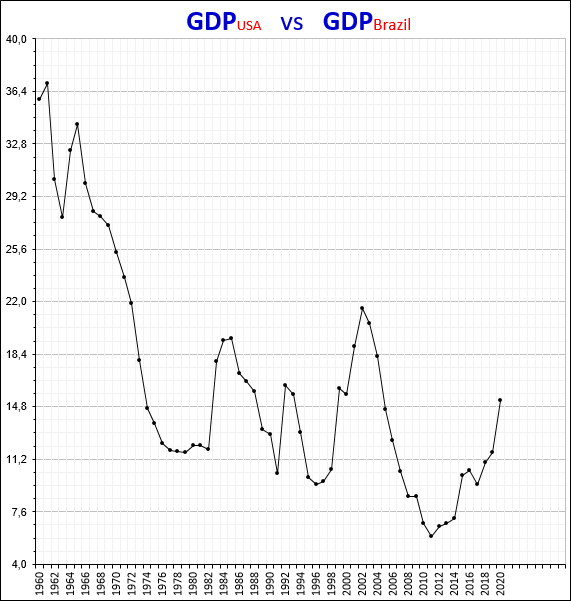
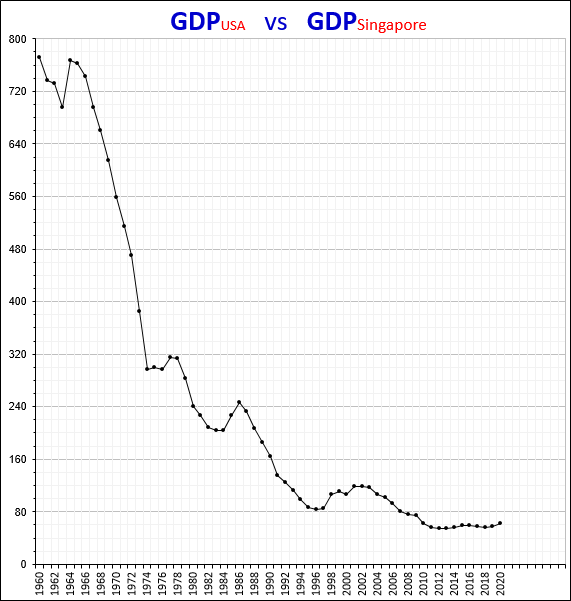
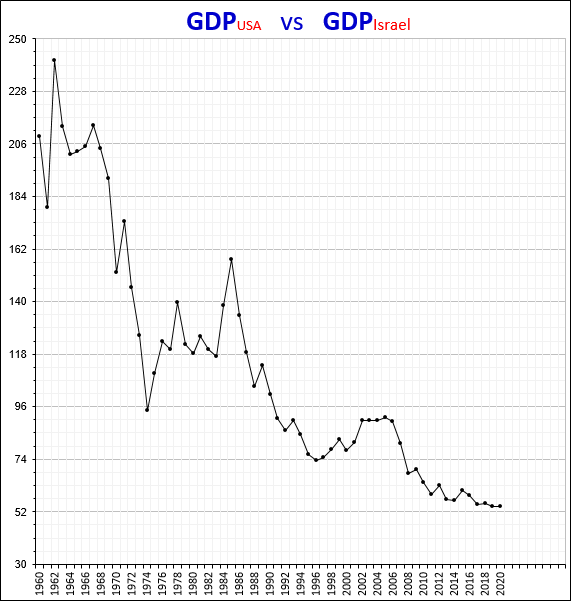
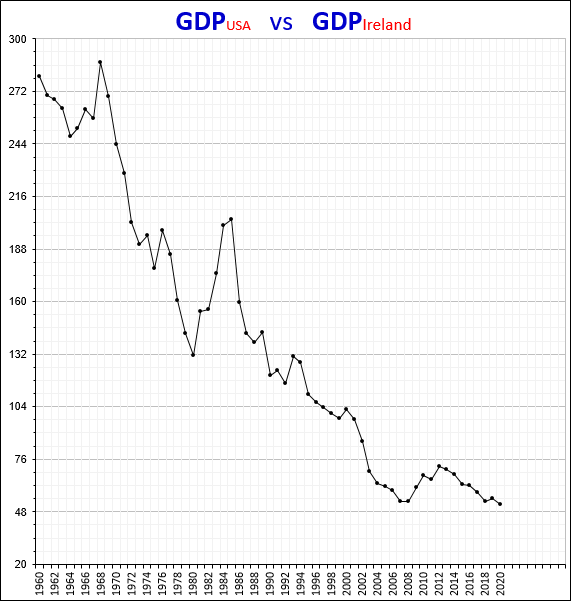
The graphs clearly show a global trend towards a decrease in the volume of US GDP in comparison with the volume of GDP of states that were in slavery to the peoples of the collective West.
3.3. Analysis of the fractal structure of the charts of the cross-rates of the Dow Jones index.
3.3.1. About cross-rates.
Knowledge of the fractal structure of the chart of a financial instrument allows modeling the future dynamics of its value based on which segment of the fractal is formed on the chart.
In order to more accurately determine the fractal structure of the chart of a financial instrument, it is necessary to carry out fractal analysis of charts of both adjacent financial instruments that make up one market and financial instruments that represent other markets, as well as fractal analysis of charts of their cross rates.
For example, the analysis of the fractal structure of the Gold chart should be complemented by the fractal analysis of the Silver chart and the cross-rate chart between Gold and Silver. Additionally, you need to analyze the charts of other precious metals and their cross-rates with Gold.
Another example, the analysis of the fractal structure of the EUR / USD chart should be complemented by the fractal analysis of the GBP/USD, AUD/USD, CHF/USD, CAD/USD, JPY/USD charts and the EUR/GBP, EUR/AUD, EUR/CHF, EUR/CAD, EUR/JPY. Additionally, you need to analyze the charts of other currencies and their cross-rates.
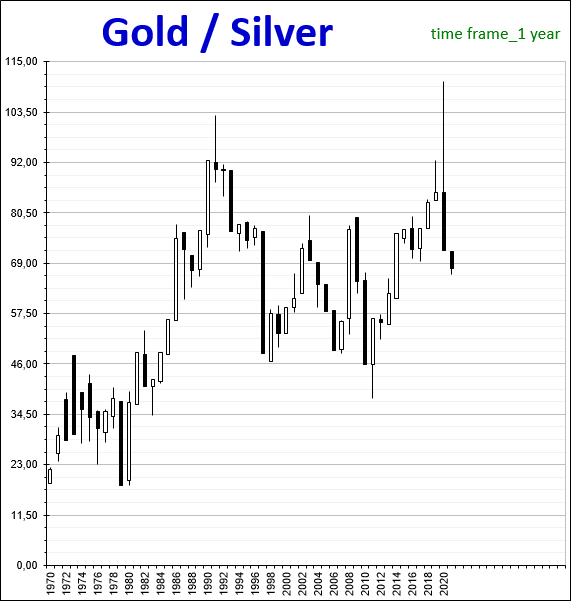
Simultaneous analysis of fractal structures on the charts of Gold, Silver and their cross-rate will allow determining the points of local and global extrema, i.e. points at which some fractals end and others begin.
If we consider the fractal structure of the EUR/USD chart, we find a correlation with the fractal structures of the GBP/USD and EUR/GBP charts, which is expressed in the almost simultaneous completion of the time intervals of fractals with a different order.
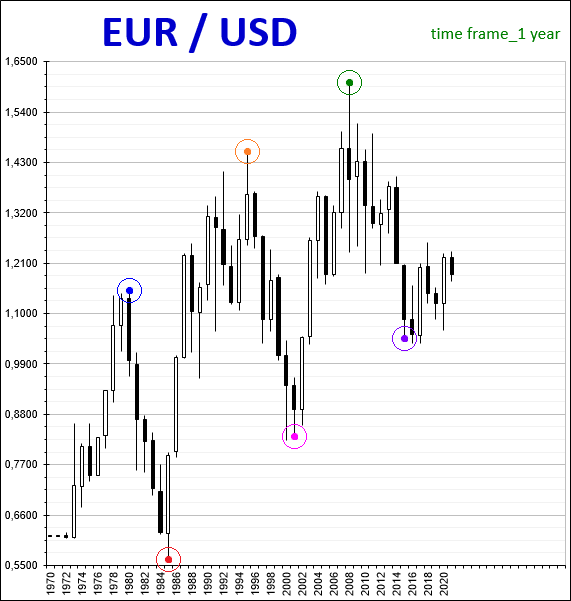
3.3.2. Dow Jones Index Currency Cross Rates.
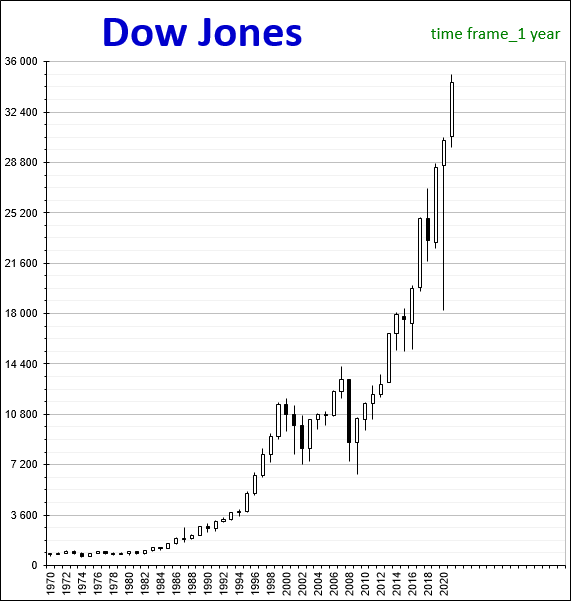
For example, if the value of the Dow Jones index is divided by the euro rate (EUR / USD), then we get the cross rate DJ / EUR, that is, in a sense, we will get the conditional value of the index not in dollars, but in euros.
3.3.3. Dow Jones commodity cross rates.
In addition to analyzing the fractal structures of the Dow Jones index cross-rate charts, it is also required to analyze the index cross-rates in relation to commodity quotes. The most important for analysis are the cross-rates of the Dow Jones Index to Oil and Gold.
If we divide the value of the Dow Jones index by the price of Oil, then we will conditionally get the value of the index in barrels, and if we divide by the value of Gold, we will get the value of the index in ounces.
3.3.4. Dow Jones Index Cross Rates.
A complete analysis of the US stock market is impossible without an analysis of the world stock market. Analysis of the fractal structure of the Dow Jones stock index chart should always be accompanied by an analysis of the fractal structure of the charts of other stock indices and their cross rates.
The cross-rate of stock indices is the ratio of the values of one stock index to the values of another stock index. The cross-rate of the stock index shows the rate of dynamics of the values of one index in relation to the values of another index.
Fractal structures on the charts of different stock indices are different, but despite this there is a correlation between the values of the time intervals of the fractals that make up the fractal structures.
3.4. Comprehensive analysis.
So, modeling the future dynamics of the values of the American stock index Dow Jones involves a comprehensive analysis, including technical and fundamental analyzes.
Technical analysis means the analysis of the fractal structure of the time series, consisting of the Dow Jones index values with time intervals of 1 hour, 1 day, 1 week, 1 month, 2 months, 3 months, 4 months, 6 months, 1 year, 2 years, 3 years, 5 years, 8 years, 10 years, 13 years, 21 years, 34 years, 55 years for the purpose of detecting fractals, identifying the sequence of their formation, as well as their order and the serial number of the segment they are. It is imperative to analyze the fractal structures of the Dow Jones index cross-rate charts for a wide range of financial assets.
Fundamental analysis means the analysis of macroeconomic indicators and the analysis of processes in the world economy and world geopolitics with the construction of future scenarios for the development of the situation and their impact on the world financial market.
There is no single model of future dynamics based on the analysis of fractal structure. There are always several such models at any given time.
The most likely model for the future dynamics of the Dow Jones index, which takes into account all the data obtained in the complex analysis, assumes the beginning of downward dynamics within the formation of the 5th order fractal F13332, and then upward dynamics within the formation of the 5th order fractal F13333.
A decline with a subsequent rise should form a fourth-order fractal F1333 until 2035 in the fractal structure of the chart.
After 2035, the global dynamics of the Dow Jones index will be downward as part of the formation of the 1st highest order fractal F2.
The model of the upcoming dynamics of the Dow Jones stock index assumes first a deep decline, then an increase to the maximum values of 2021, followed by the collapse of the bubble and the collapse of the US stock market, which will begin in 2035.
To understand the possibility of such a scenario developing, it is enough to look at what the United States is today and where it is going tomorrow.
The United States, as a state whose leaders take an oath by laying their hands on the Bible, and then, in fulfilling their duties, violate absolutely all the commandments given to us in the Holy Scriptures by the Lord God Jesus Christ, is doomed to disintegration.
The Catholic Church, which left the True Orthodox Christian Church, logically brought the matter to the immersion of American society in sectarianism, turning the United States into a satanic state, whose president personally propagates the most disgusting sexual perversions around the world, plunging into which the bitter consequences described in the Bible will await.
The “free” society of the United States did not even notice how it was still free from God. And this says only one thing, if the people of the United States do not change their minds and do not return to God, then the disappearance of the United States as a state will become a matter of time.
A strong polarization of society with a huge number of firearms in its hands on material, social and religious grounds against the background of inadequate actions of the authorities to resolve both external and internal conflicts will inevitably lead to armed clashes, as a result of which the territory of the state will inevitably be divided between whites (descendants of slave owners), black (descendants of slaves) and the rest, painted in all colors of the rainbow, the population.
In the USA, the interests and values of each stratum of society are unacceptable to the other two strata of society. The ideological contradictions between these three strata of society are so strong and so deep that their stay in one state becomes an unnatural state and is well described by one phrase from a beautiful fable: "One day, a swan, a crab and a Pike took a load of luggage, and together the three all harnessed themselves to it...".
In general, the degree of boiling in American society will raise the temperature inside the melting pot to such a level that it will begin to melt itself, regurgitating all of its contents.
The degradation of US power is clearly traced in the inability to conduct fair, fair and legitimate elections for the head of state, in which one inadequate president is replaced by an even more inadequate one. The last three US election campaigns demonstrate this well.
One is an evil descendant of slave traders, imagining himself a peacemaker, tearing to shreds what is not stronger than a banana. The other is a showman, a television clown, easily sagging under pressure and threats to his financial well-being, which is why he constantly changes his decisions like a weathervane while taking one step forward and ten steps back. The third is generally a feeble-minded, real moron, who does not understand how and with whom to talk, what can and cannot be said; the speaker today is exactly the opposite of what was said earlier; lost in space and time, unable to formulate his thoughts on his own without cheat sheets and focusing on the voice from the prompter in his ear; who does not remember the names of his subordinates, or the names of close relatives, not to mention the names of states and the names of their leaders, and who can simply fall asleep during negotiations, justifying the nickname given to him by the clown.
If an evil peacemaker denigrated the World with wars and conflicts for two terms, a clown amused the public for one term, then a person with dementia will not serve a term as president. With this leadership dynamic, the next US president will be the last president to bury the state.
The USA with nuclear weapons turns into a monkey with a grenade, the unpredictability of behavior of which poses a threat both to others and to the monkey itself. Replacing the pomegranate with bananas will be a painful measure, but it is forced and meets, first of all, the interests of the monkey itself.
4. Conclusion.
In the end, I want to note that the article was planned to be small in size with a brief summary of the essence of the modeling method, but it turned out to be quite extensive. However, despite this, there is not a single superfluous word in it.
Words always mean something. Words are the form of thoughts.
The conceived thoughts are transmitted to the surrounding by words and materialized by deeds.
The word is like energy, which can be either positive or negative.
You need to know and always remember that
- a good, kind word energizes and builds;
- a bad, bad word destroys;
- and the word of truth, the word of truth, always enlightens.