Speculator's diary.
Entry №15, 27.12.2023.
Deal with XAU/USD. Yield 24'250,33%.
The assumption made on December 8, 2023 about the formation of a blue fractal turned out to be correct (Fig. 15-1). We can assume that the increase in gold prices, which began on December 11, 2023, is taking place within the framework of the formation of the 3rd segment of the blue fractal.
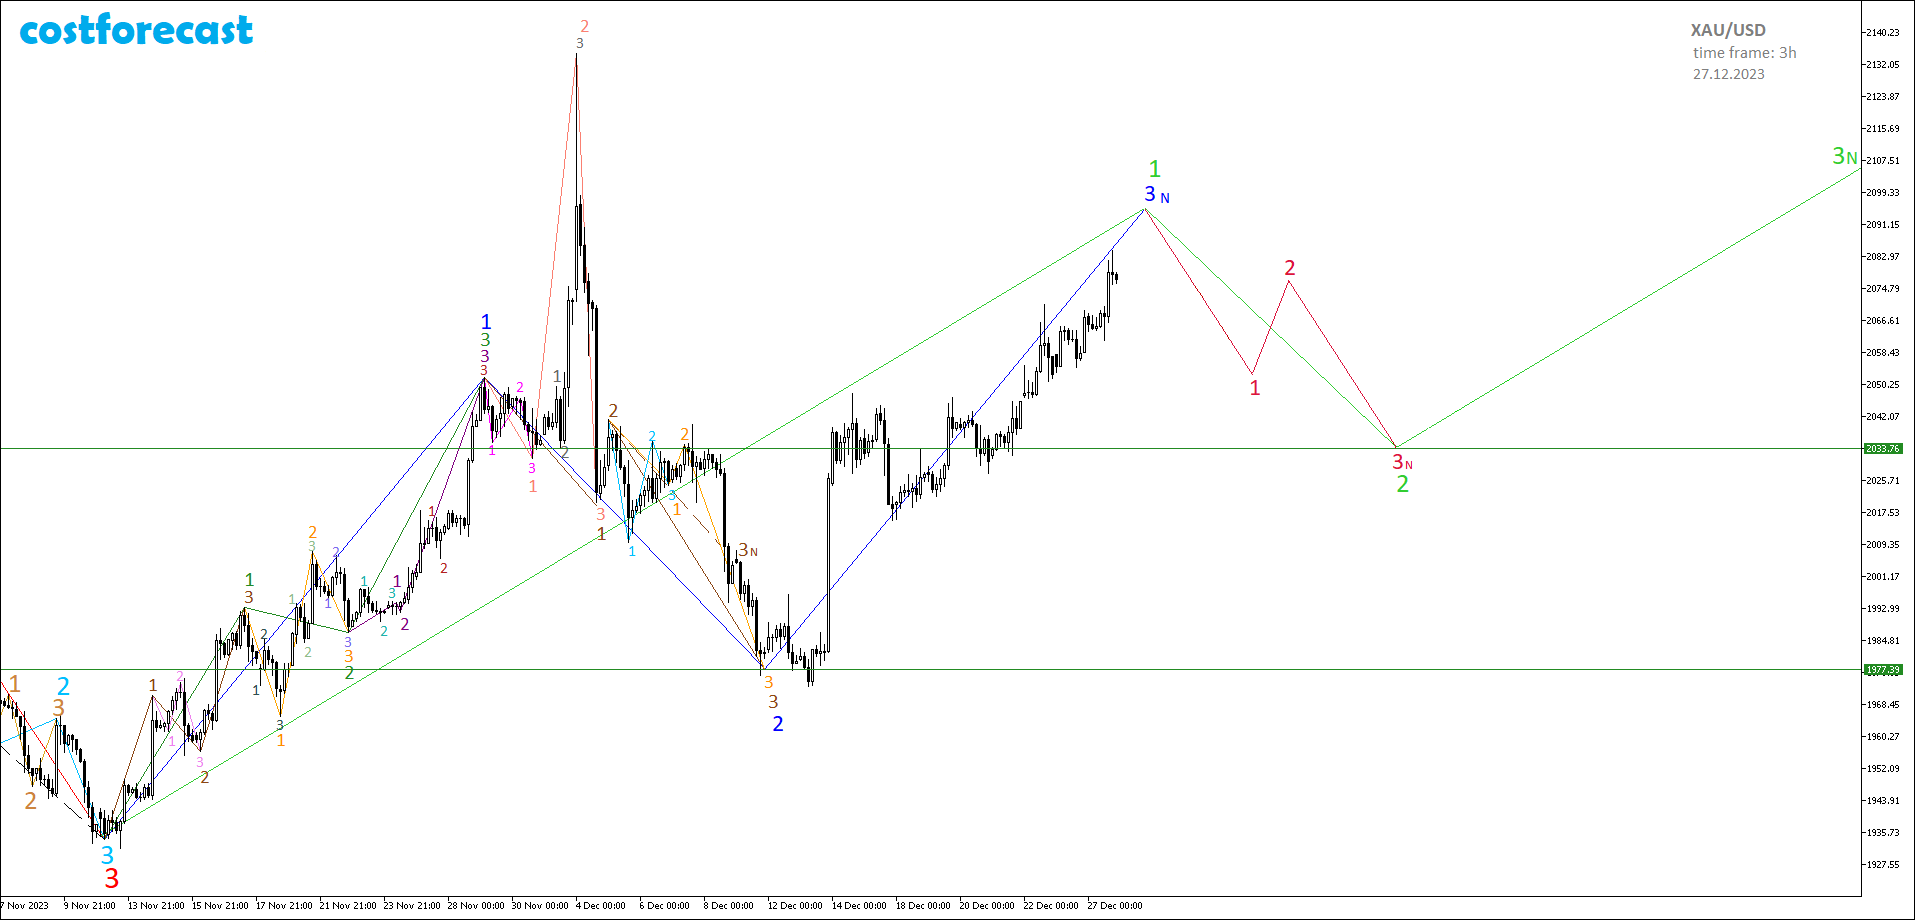
Fig. 15-1
A progressive upward trend assumes the completion of the 3rd segment of the fractal at a point located above the completion point of the 1st segment of this fractal. As of December 27, 2023, current gold quotes are already higher than the quote in which the completion of the 1st segment of the blue fractal occurred. The logic of the development of upward dynamics dictates the rewriting of the maximum and the completion of the 3rd segment of the blue fractal at around $2,148 per ounce (Fig. 15-2).
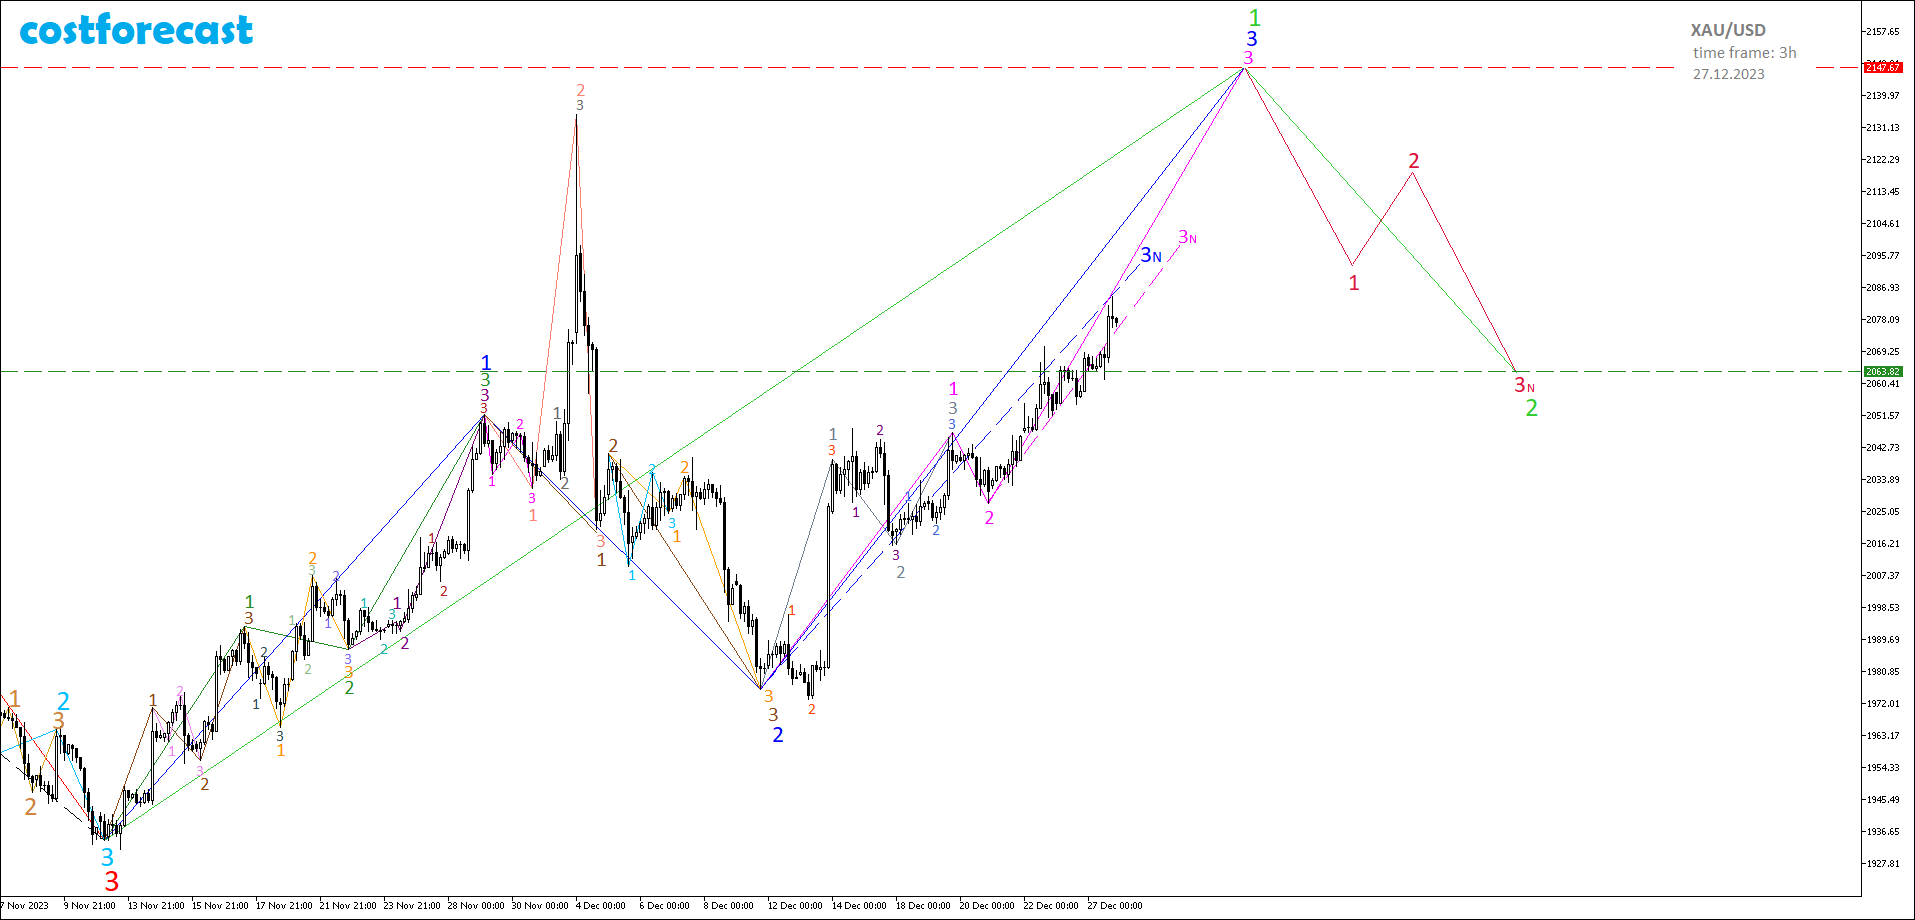
Fig. 15-2
Taking into account the analysis of the fractal structure of the graph, we can assume that the 1st segment of the blue fractal was formed on the time interval (11/13/2023_13:00; 11/29/2023_03:00), and the 2nd segment of this blue fractal was formed on the time interval (11/29/2023_03 :00; 12/11/2023_18:00).
In this case, the current dynamics of gold prices is in the stage of forming a fractal, which is indicated in Fig. 15-2 in pink and which is the 3rd segment of the blue fractal.
The 1st segment of the pink fractal was formed in the form of a fractal F№32 (from the Niro Alphabet) of one lesser order, which is indicated on the chart in gray on the time interval (12/11/2023_18:00; 12/19/2023_18:00). The 2nd segment of the pink fractal was formed on the time interval (12/19/2023_18:00; 12/20/2023_21;00). In this case, the current dynamics of gold quotes takes place within the framework of the formation of the 3rd segment of this pink fractal, the possible completion of which will be at around $2,148.
Completing the pink fractal at $2,148 will complete the 3rd segment of the blue fractal, which is one higher in order, which in turn will complete the 1st segment of the bright green fractal, which is two units higher in order than the pink one (Fig. 15-2). After reaching $2,148, the upward trend will pause until the 2nd segment of the green fractal with parameters (P2=0.382*P1 and T2=0.236*T1) is formed in the fractal structure of the chart, schematically shown in the form of a red fractal F№22 with completion at $2064 per ounce.
Taking into account the above assumptions, the current fractal structure on the chart with a daily time frame is shown in Fig. 15-3

Fig. 15-3
Taking into account the global fractal structure of the chart, it was decided to close a long position opened on 12/08/2023 with a volume of 0.01 lot on the “costforecast” account at $2081.68 and immediately open a long position with a volume of 0.02 lot at the current quote of $2082.05 with subsequent possible closing at $2,145.

Fig. 15-4
The long position on transaction No. 13 was open for 19 days and, with a price change of 3.89%, brought an income of 70.89 USD (Fig. 15-5).
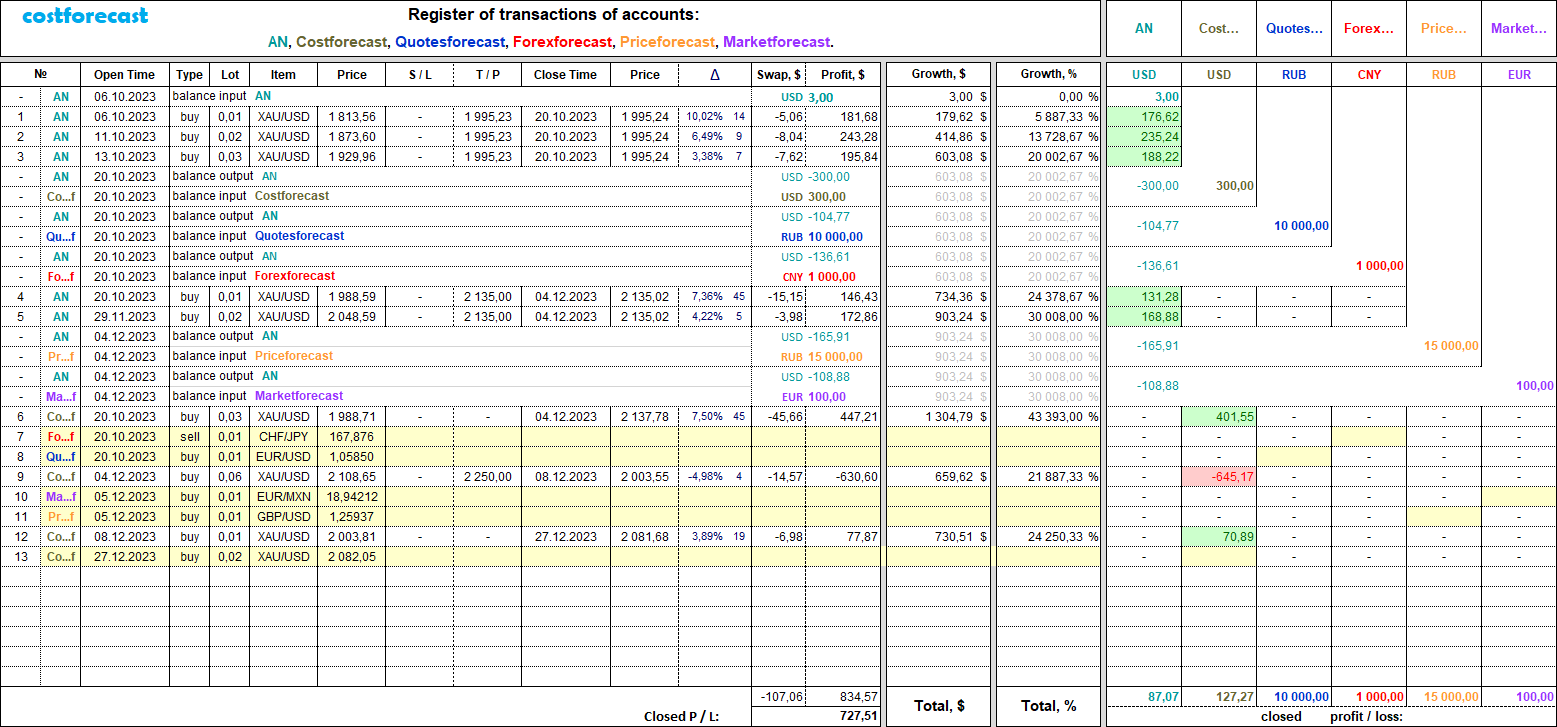
Fig. 15-5
See the hidden! More to come.
You can learn about the modeling method in the article “Apophenia as an apologist for clairvoyance in capital markets”.
You can familiarize yourself with the alphabet for reading graphs by watching the short video “Alphabet of Niro Attractors”.
You can monitor transactions carried out on your accounts online by following the links posted on the costforecast website in the “trading signals” section.