Speculator's diary.

Entry №14, 08.12.2023.
Deal with XAU/USD. Yield 21'887,33%.
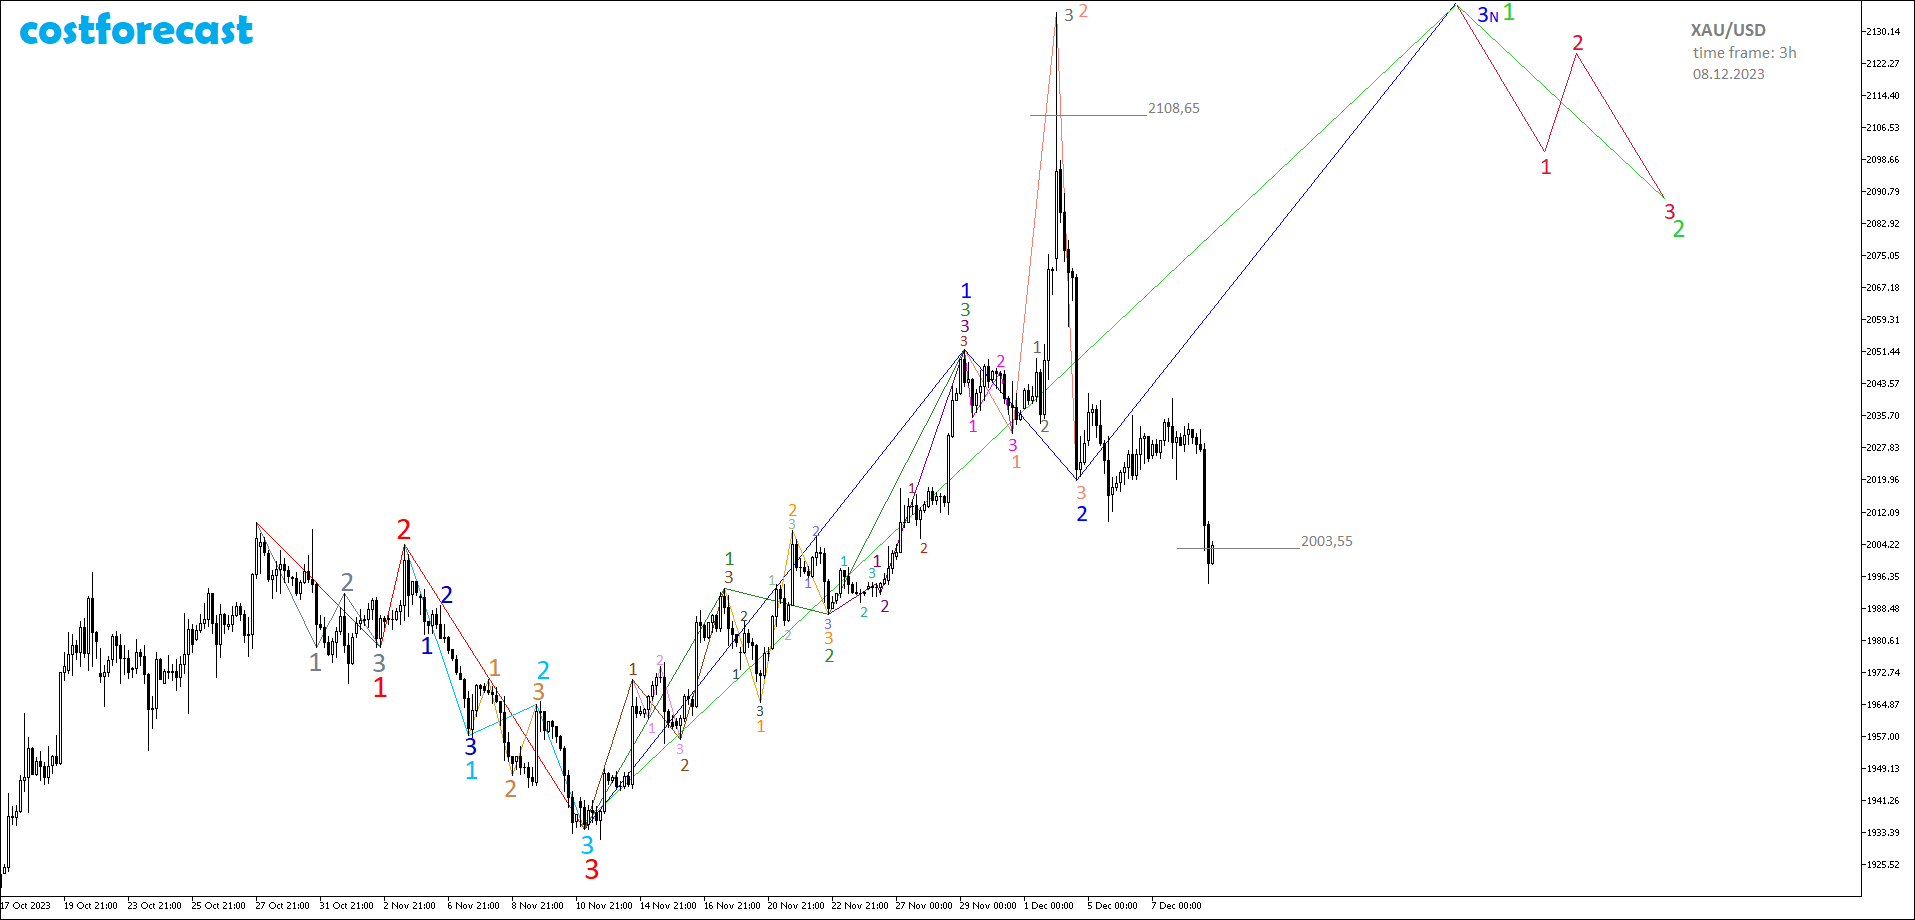
The dynamics of gold quotes for 12/08/2023 showed that in the fractal structure of the chart on the time interval (11/29/2023; 12/04/2023), the fractal indicated in pale red cannot be considered as the 2nd segment of the blue fractal (Fig. 14-1). A continued decline in quotes may indicate that the 2nd segment of the blue fractal is still being formed.

Fig. 14-1
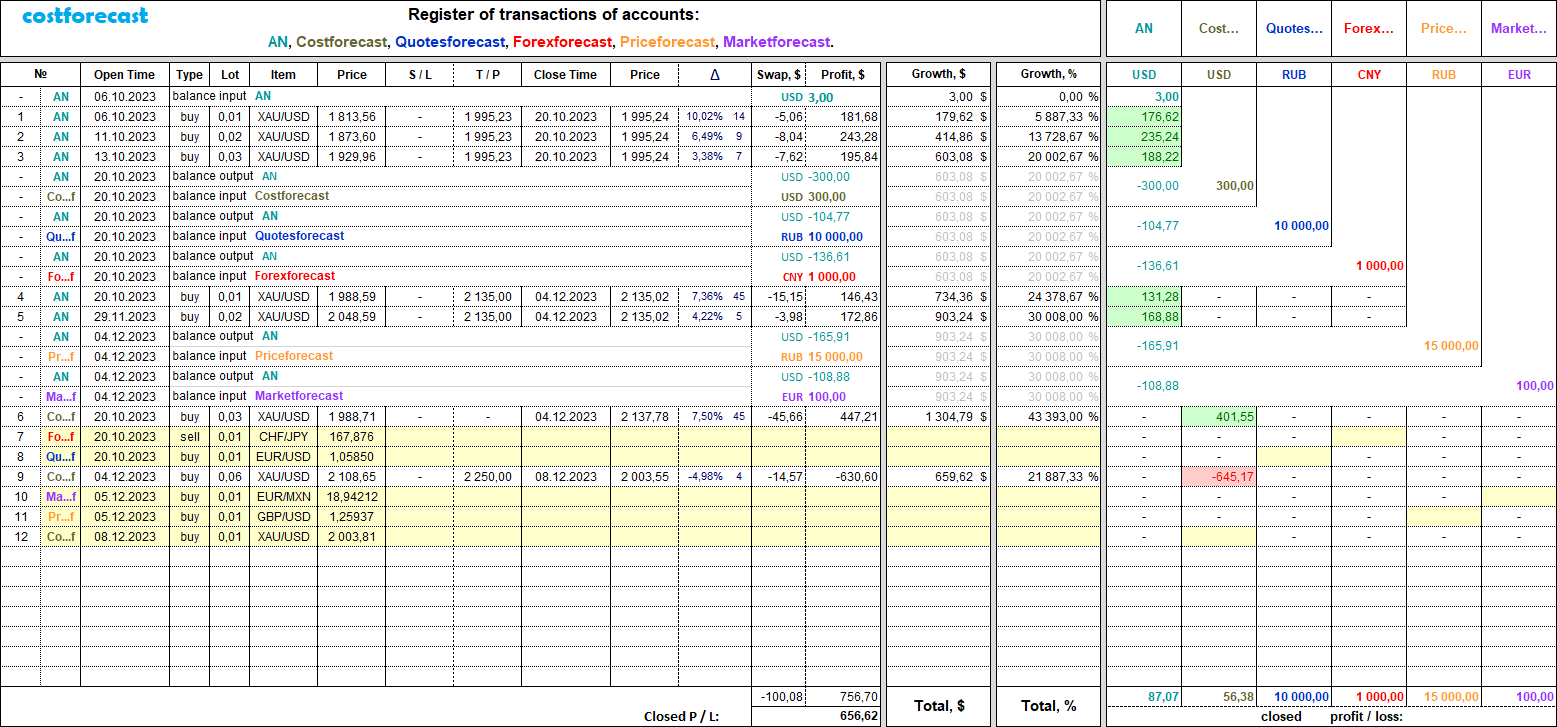
A long position on the XAU/USD instrument, which was opened on December 4, 2023 on the “costforecast” account with a volume of 0.06 lot at a quote of 2108.65, was closed at a price of 2003.55. A change in value of 4.98% brought a loss of -645.17USD. The position was closed at $2003.55 per ounce due to the high probability of continued decline in quotes, followed by forced closure of the position via a margin call if the price drops below $2003.55 by another $9.
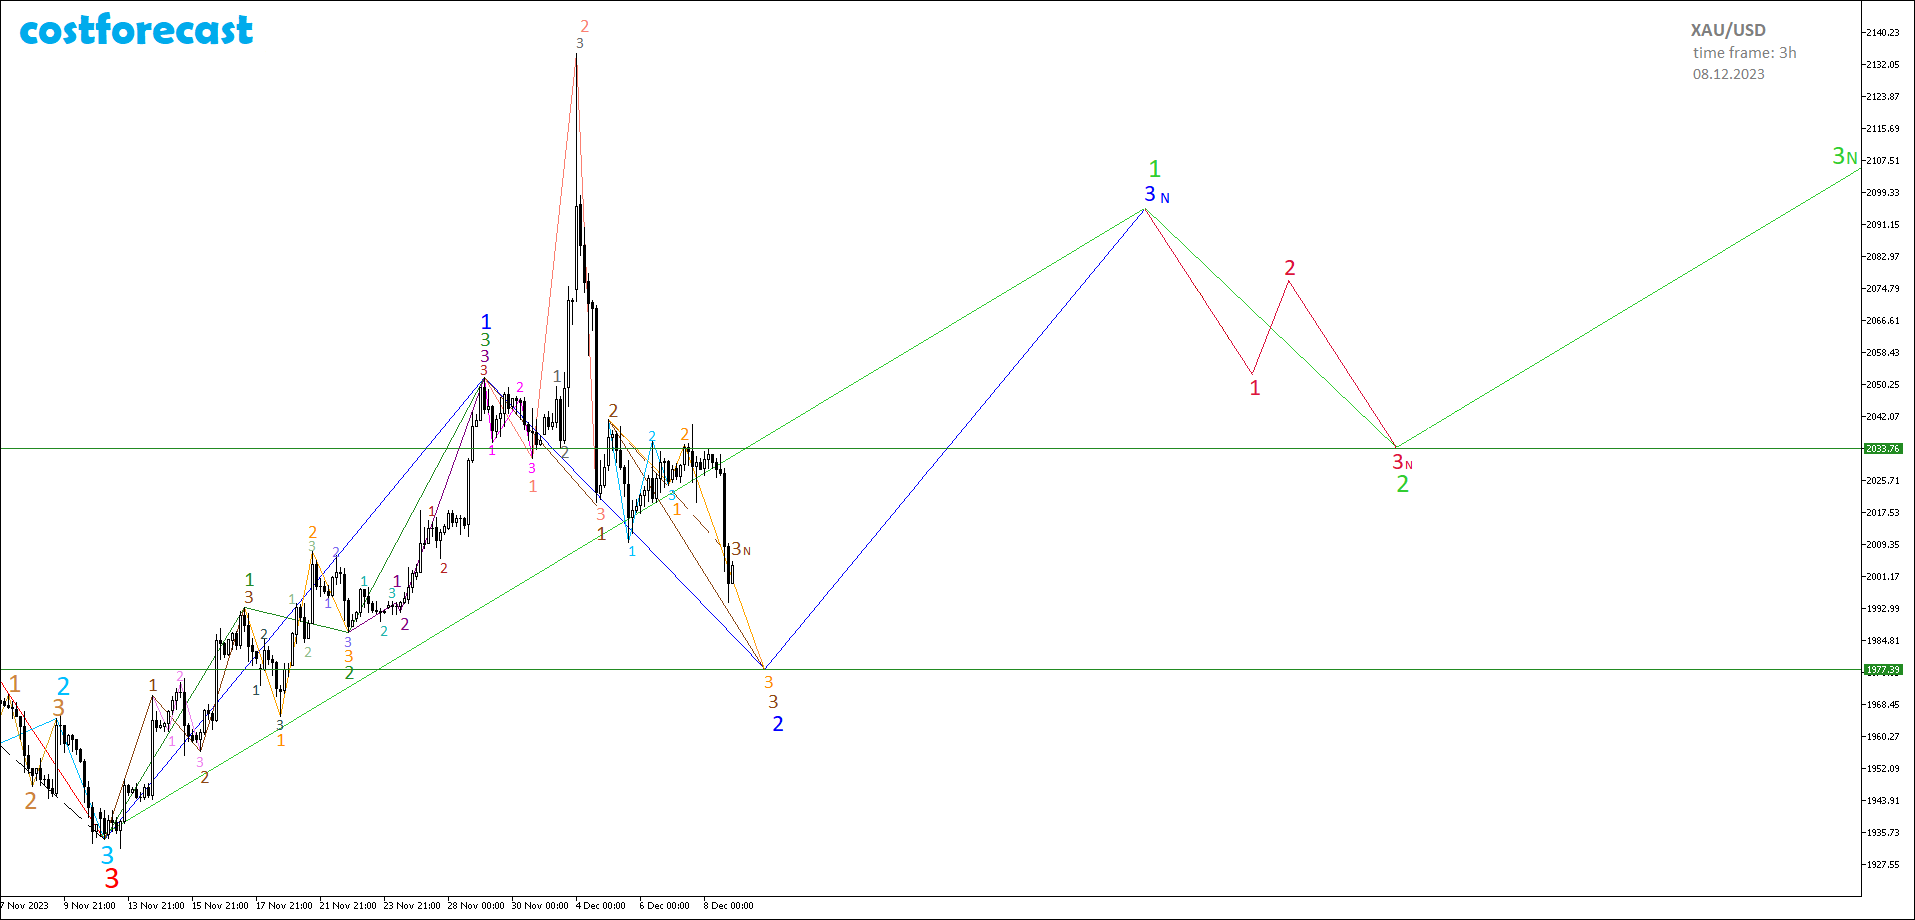
Despite the decline in quotations, it is too early to revise the previously made model of the future dynamics of gold quotations. The scenario in which a blue fractal should form in the fractal structure still remains a priority.
In this case, the assumption that on the time interval (11/13/2023; 11/29/2023) the fractal indicated in green is the 1st segment of a fractal of one higher order of blue color, implies the completion of the 2nd segment of this blue fractal at a level not lower than 1977 .39 dollars (P2=0.618*P1) (Fig. 14-2).

Fig. 14-2
Taking into account this assumption, the 2nd segment of the blue fractal can be formed in the form of fractal F№12 (from the Niro Alphabet), which is indicated on the chart in brown with the parameters: P3=2*P1 and T3=1.382*T1.
After which, the growth of quotes should continue within the framework of the formation of the 3rd segment of the blue fractal, the completion of which will mean the completion of the 1st segment of the bright green fractal, which has an order of one more, followed by a corrective movement down and the formation of the 2nd segment of the bright green fractal with parameters: P2=0.382*P1 and T2=0.236*T1.
Based on the global fractal structure, dictating an upward trend with rewriting of the maximums and taking into account the possible formation of a brown fractal F№22, the 3rd segment of which is indicated by a dotted line as 3N, a decision was made immediately after closing a long position with a volume of 0.06 lot immediately open a new long position with a volume of 0.01 lot at a price of $2003.81 per troy ounce (Fig. 14-3).

Fig. 14-3
The profitability of completed transactions is 21,887.33%. Positions opened on different trading accounts are marked in the consolidated table with a yellow shading (Fig. 14-4).

Fig. 14-4

See the hidden! More to come.
You can learn about the modeling method in the article “Apophenia as an apologist for clairvoyance in capital markets”.
You can familiarize yourself with the alphabet for reading graphs by watching the short video “Alphabet of Niro Attractors”.
You can monitor transactions carried out on your accounts online by following the links posted on the costforecast website in the “trading signals” section.
 — Бесплатные Сайты и CRM.